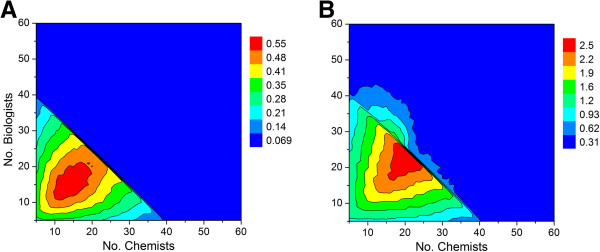
Figure 12.

Contour plot showing relationship between number of chemists, biologists and predicted output for a 1:1 ratio of high priority and standard priority lead optimization campaigns. Cut-off values of 3.5 and 4.5 years were applied for hit to lead and lead optimization activities, respectively, after which the projects were simply terminated. See Table 1 for all other assumptions. (A) Output as defined by the average number of preclinical candidates per year. (B) Output defined by the average number of active lead optimization projects per year.
