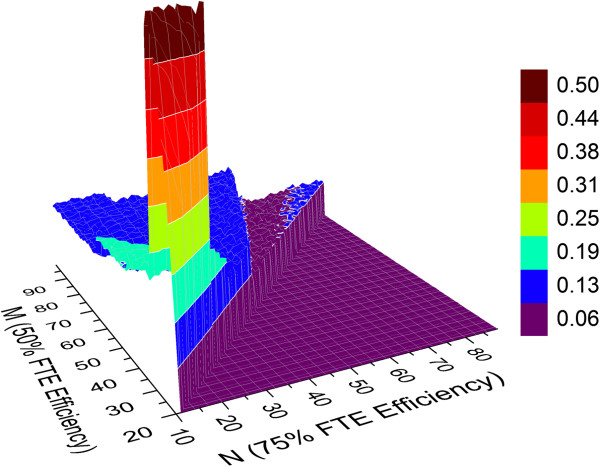
Figure 13.
Productivity difference map between two FTE efficiency simulations that systematically varied M and N for 18 chemists and 18 biologists (1:1 ratio of high priority to standard priority lead optimization projects). The only difference between the two runs is the presence or absence of project lifetime cut-off values applied for hit to lead and lead optimization activities (3.5 and 4.5 years, respectively). See Table 1 for all other assumptions. The values along the z-axis represent the difference in predicted productivity output between the two simulations, where productivity is slightly higher in the absence of timeline constraints.

