Figure 6.

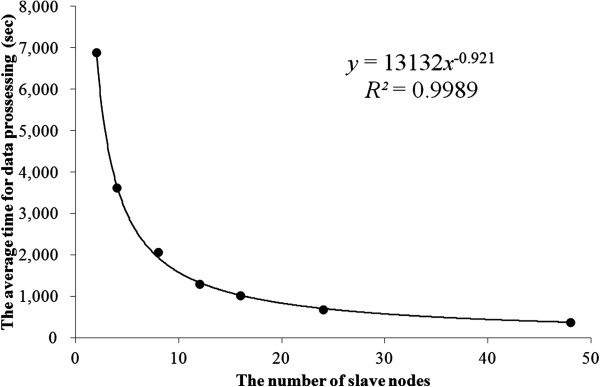
Scaling benchmark. Dots indicate the average processing time for 20 trials. The line indicates the prediction equation fitted with a power regression.

Scaling benchmark. Dots indicate the average processing time for 20 trials. The line indicates the prediction equation fitted with a power regression.