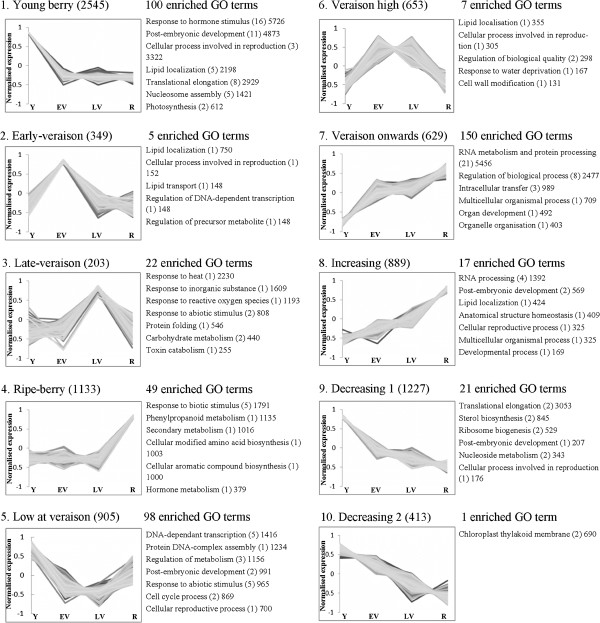
Figure 3.
Clustering and gene ontology enrichment of developmentally regulated transcripts. Transcripts displaying some degree of developmental regulation were clustered using the K-means method and Euclidean similarity. A description of the pattern of expression and the number of transcripts belonging to the cluster form the title of each chart. Expression values were normalised and scaled between -1.0 and 1.0 (y-axis). Enriched GO terms, generated in AGRIGO and summarised using REVIGO, are listed to the right of each cluster. Only “Biological Process” terms are reported, except for Cluster 10, where the single enriched term was a “Cell Component”. The number of sub-terms combined under the representative description is shown in parentheses, and a value proportional to the statistical significance of enrichment relative to all GO terms in the grapevine transcriptome is given as an indication of the relative level of enrichment (see Methods). Specific transcripts belonging to each presented cluster can be found in Additional file 1: Table S1. Y, young berries (E-L 31); EV, early-veraison (E-L 35); LV, late-veraison (E-L 36); R, ripe berries (E-L 38).

