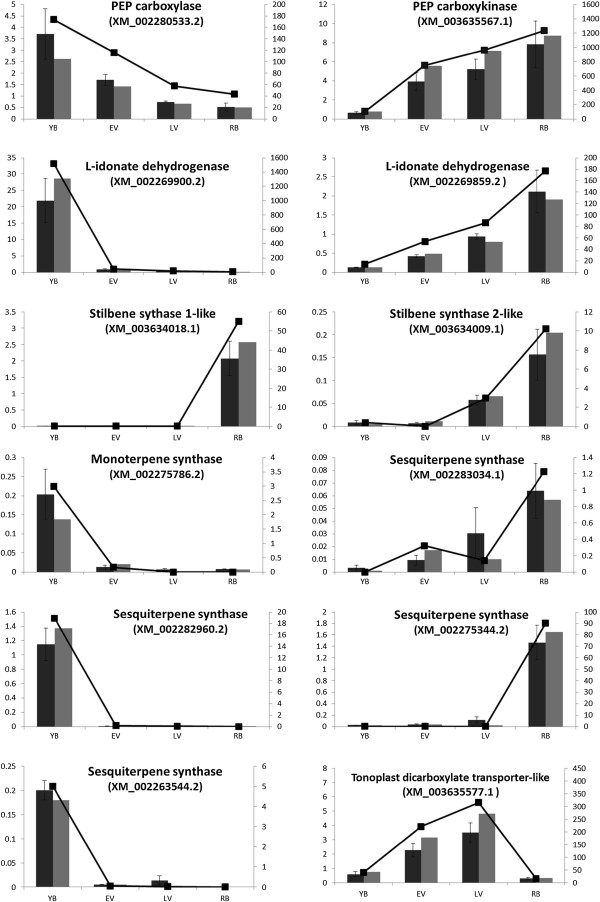
Figure 4.
Quantitative RT-PCR validation of differential transcript expression observed for selected genes. Comparison of transcript expression for selected genes as measured by RNA-Seq and qRT-PCR. Lines represent expression determined by RNA-Seq in RPKM units (right axis), while histograms represent transcript expression determined by qRT-PCR and normalised to three control genes (left axis; normalised units). Dark grey columns are the average of three biological replicates, with errors bars displaying SEM and light grey columns show the individual replicate on which RNA sequencing was carried out.

