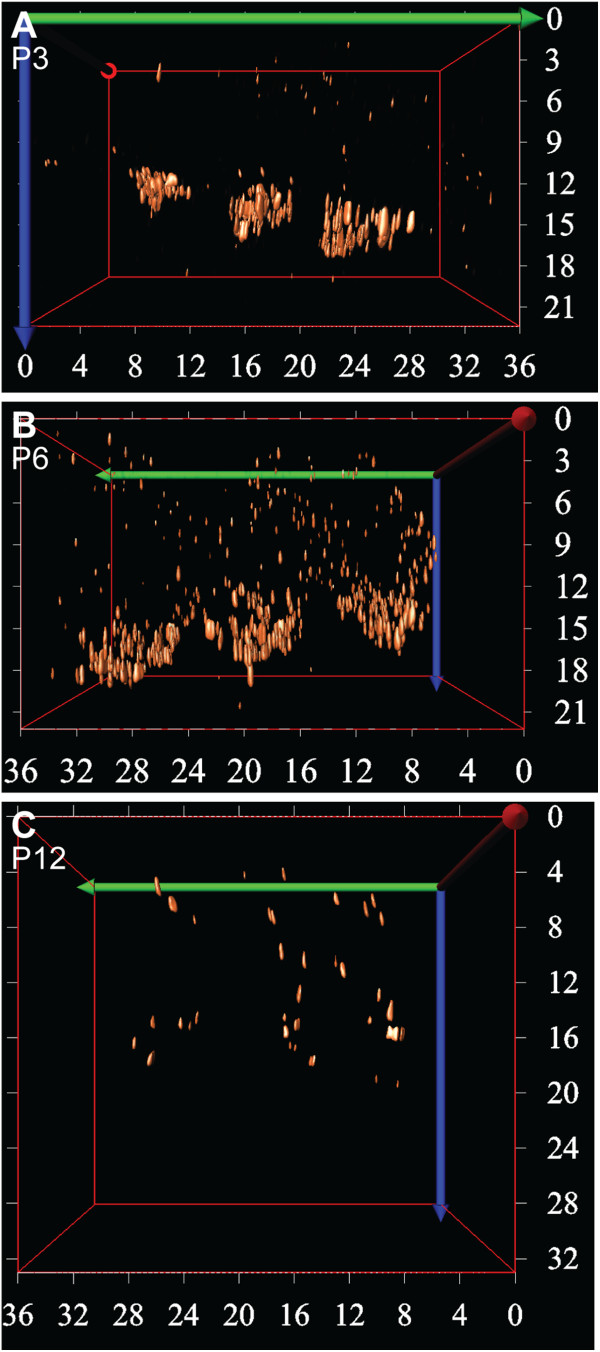
Figure 3.
3D reconstruction of the ribbons in OHCs during cochlear development.A-C Confocal images of one row of whole mount cochlear preparations immunostained against CtBP2/RIBEYE at (A) P3, (B) P6, and (C) P12 were deconvolved prior to 3D reconstruction (Image Pro Plus with 3D suite). Numbers on the X and Y axis represent mm in the Y and Z direction respectively. The 3D reconstructions reveal the spatial distribution of the CtBP2/RIBEYE puncta in the OHCs, which were highly concentrated in the basal synaptic region of the OHCs at P3, before dispersing at P6 and then significantly downregulated by P12. The lateral and medial sides of the OHCs are at the left and right sides of each image respectively. The first row of OHCs is on the right side and the third row of OHCs on the left side of each image.

