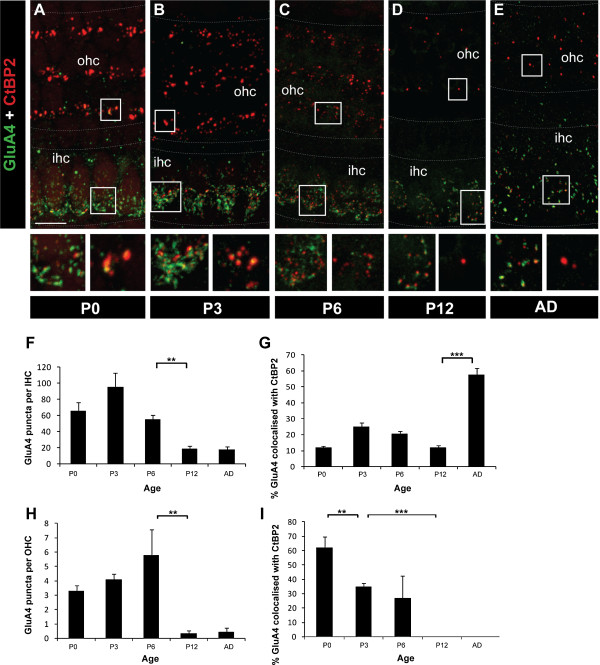
Figure 6.
Changes in GluA4 subunit in IHCs and OHCs during development.A-E Example maximal projection whole-mount confocal images of GluA4 (green) and CtBP2 (red) immunolabelling from P0 to adult. Scale bar 10 mm. Grey dotted lines delineate the OHC and IHC regions. F Quantification of the average total number of GluA4 puncta per IHC from P0 to adult. G Quantification of the developmental changes in synaptic GluA4, as assessed by per cent co-localisation with CtBP2/RIBEYE puncta, in IHCs. H Average total number of GluA4 puncta per OHC from P0 to adult. I Percent of synaptic GluA4, as measured by per cent co-localisation with CtBP2/RIBEYE puncta, from P0 to adult. In all graphs, data are represented as mean ± SEM; n ≥ 5 in all age groups. **p < 0.005, ***p < 0.001.

