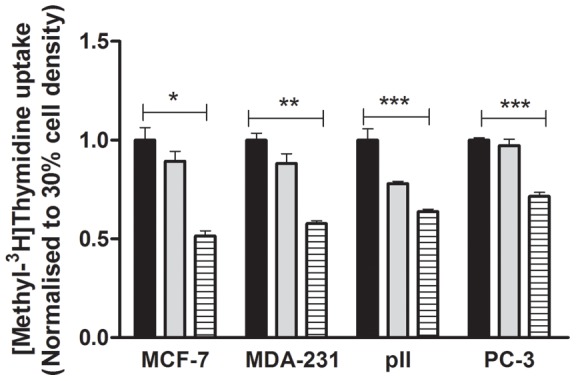
Figure 3. [Methyl-3H]thymidine uptake for each of the four cell lines used in this study.

For comparison, the uptake at 30% confluency (black solid rectangular) was assigned as 1 and uptake at 50% (grey solid rectangular) and 100% (hatched bars) densities was expressed relative to this. Histobars represent mean ± SD of 3 replicates. One way ANOVA showed significant differences with p<0.0001 (*), p = 0.004 (**), p = 0.002 (***).
