
Figure 6. Expression of PCNA and Ki-67.
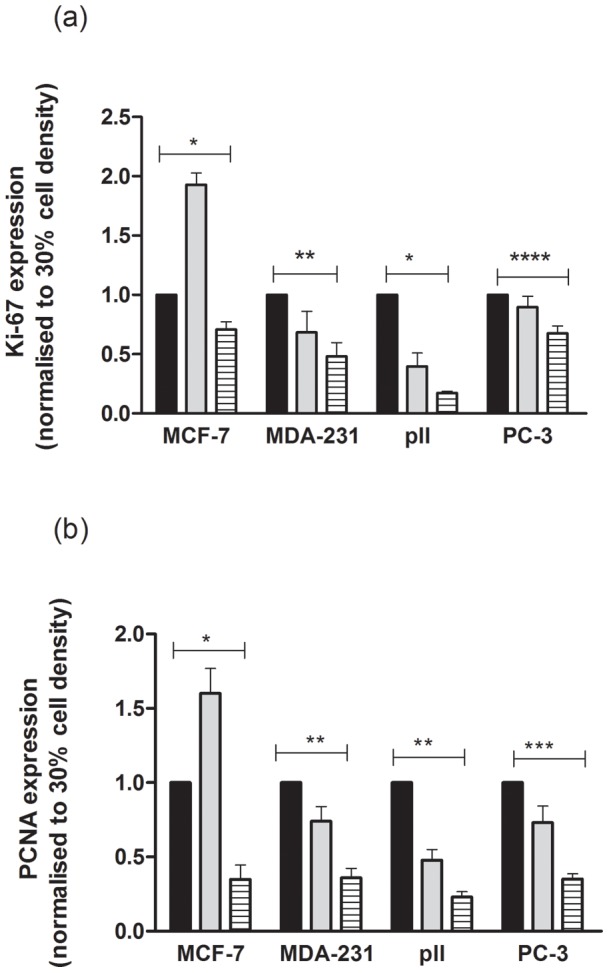
RNA was extracted from cell lines grown to 30, 50 and 100% confluency as indicated, and after reverse transcription subjected to Taqman PCR as described in Methods. The 2(−ΔΔCt) method was used to calculate the ratio of each gene relative to actin. Values for 50% (grey solid rectangular) and 100% (hatched bars) densities are normalized to those at 30% confluency (black solid rectangular). Each histobar represents mean ± SD for 3 replicates. (a)For Ki-67 one way ANOVA showed significant differences with p = 0.0003 (*), p = 0.006 (**) and p = 0.03 (***). (b) For PCNA one way ANOVA showed significant differences with p = 0.0008 (*), p<0.0001 (**) and p = 0.0003 (***).