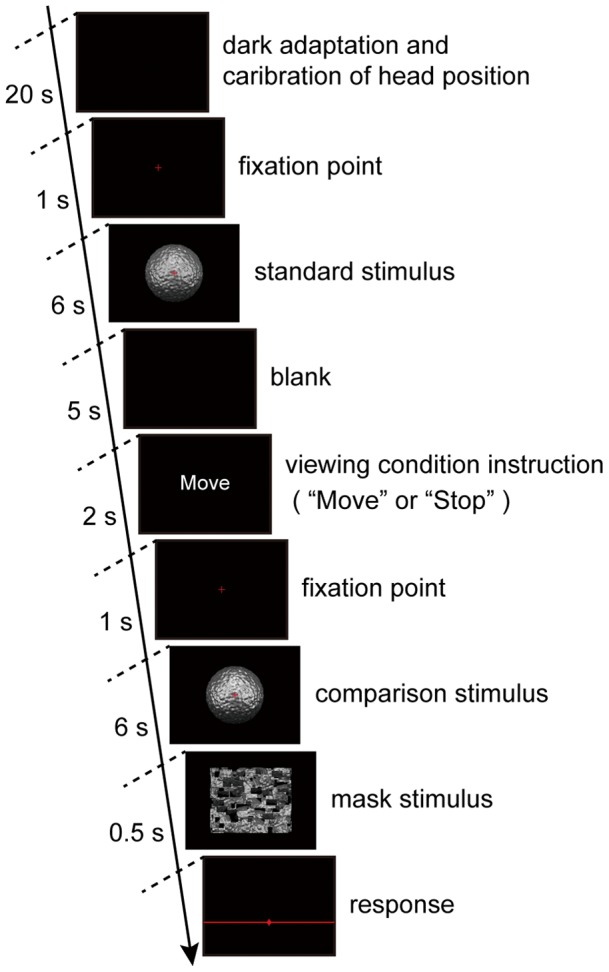
Figure 3. Flowchart of the experimental procedure.

The time sequence of one session is shown. The first three frames were presented once and then those from the blank to the response were repeated 28 times. Further details are given in the text.

The time sequence of one session is shown. The first three frames were presented once and then those from the blank to the response were repeated 28 times. Further details are given in the text.