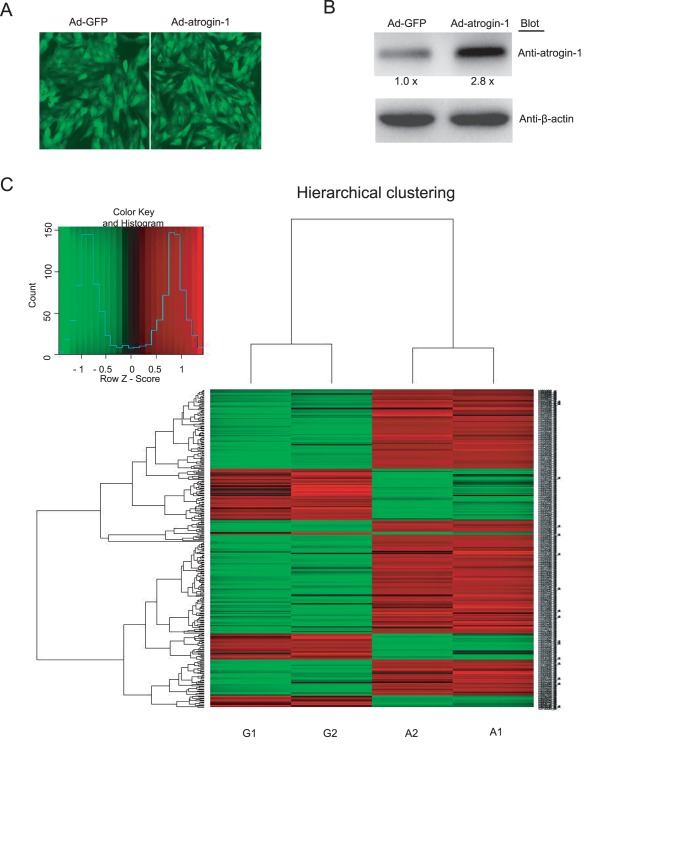
Figure 1. Infection of adenovirus atrogin-1 and microarray analysis.
A. Neonatal rat cardiomyocytes were infected with adenovirus green fluorescent protein (GFP) control (Ad-GFP) or atrogin-1 (Ad-atrogin-1). The infection efficiency was visualized for GFP 24 hours later using fluorescence microscopy (Magnification, ×400). B. The levels of atrogin-1 protein were determined by Western blot analysis with anti-atrogin-1 antibody, using β-actin as the internal control. Quantitative analysis of protein bands was shown (n = 3). C. Hierarchical clustering depicting expression profiles of differentially expressed genes in Ad-atrogin-1 (A1 and A2) and Ad-control (G1 and G2) groups. Data from individual sample are shown. A subset of genes displays significant expression changes at ≥2-fold or ≤−2-fold. Gene expression levels are shown as color variations (red: up-regulated expression; green: down-regulated expression).

