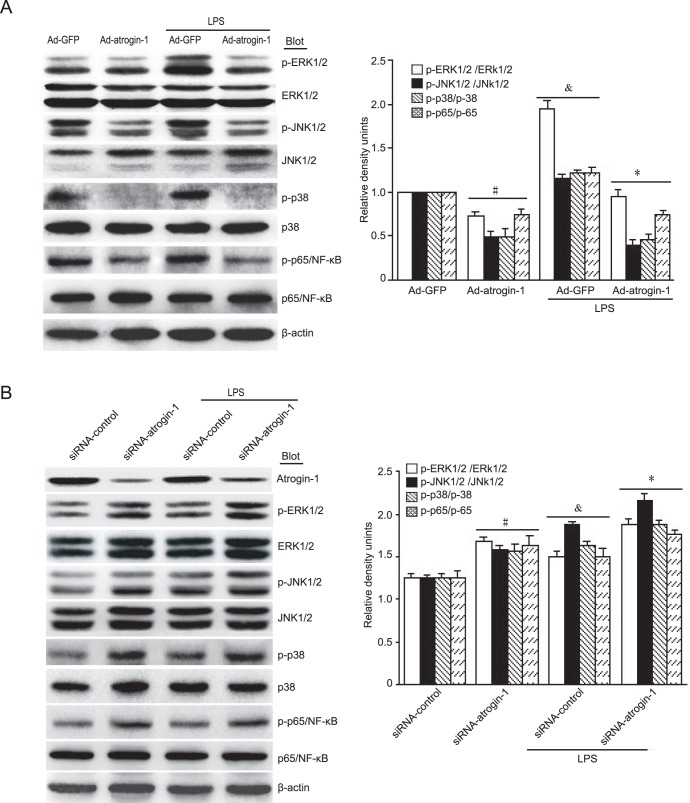
Figure 6. Effects of atrogin-1 on MAPK and NF-κB signaling pathways.
A. Neonatal rat cardiomyocytes were infected with Ad-GFP or Ad-atrogin-1-GFP for 24 h and then treated with LPS (1 µg/ml). The protein levels of total and phospho-ERK1/2, JNK1/2, p38 and p65/NF-κB were detected by Western blot analysis (left panels). Quantitative analysis of relative intensity of phosphorylated proteins was shown (right panel). Data represent the mean ± SEM (n = 3). # P<0.05, & P<0.05 vs. Ad-GFP; *P<0.01 vs. Ad-GFP+LPS. B. Neonatal rat cardiomyocytes were infected with adenovirus siRNA-control or siRNA-atrogin-1 and then treated with LPS (1 µg/ml). The protein levels were detected as in A (left panels). Quantitative analysis of relative intensity of phosphorylated proteins was shown (right panel). Data represent the mean ± SEM (n = 3). # P<0.05, & P<0.05 vs. siRNA-control; *P<0.05 vs. siRNA-control+LPS.

