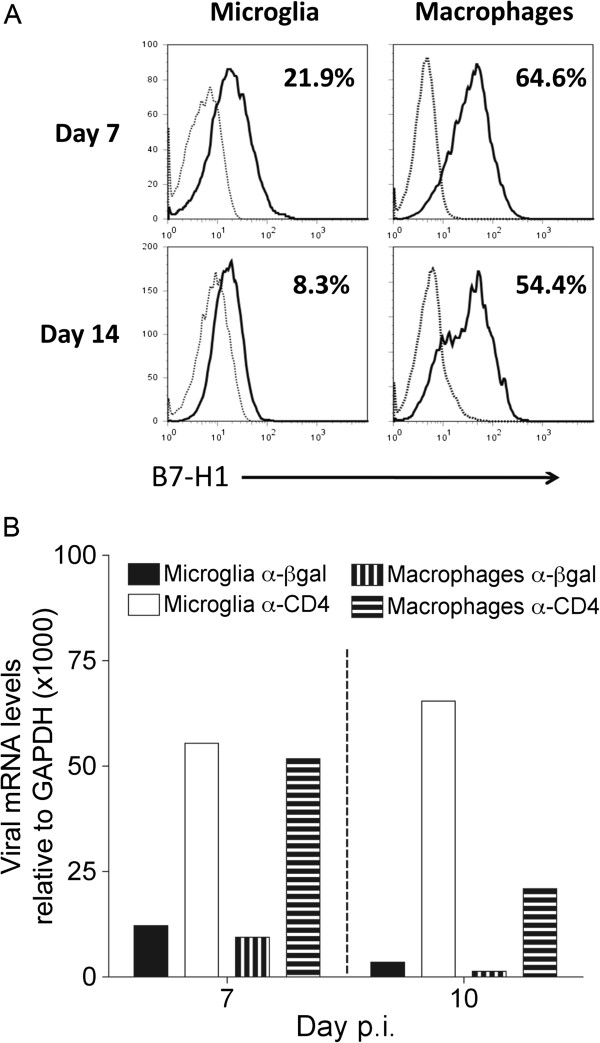
Figure 6.

Central nervous system-infiltrating macrophages display enhanced B7-H1 expression relative to microglia. (A) B7-H1 expression on CD45lo microglia and CD45hiF4/80+ macrophages from spinal cords of infected wild-type mice at the indicated days post-infection (p.i). Flow-cytometry histograms depict B7-H1 expression by solid lines, and isotype-control staining by dashed lines. Numbers represent percentages of B7-H1 positive cells relative to isotype controls. Data are representative of two independent experiments with three to five mice per timepoint. (B) Transcripts encoding viral nucleocapsid protein in microglia and macrophages purified from CD4-competent or CD4-depleted B7-H1−/− mice (n = 6 to 8) at 7 and 10 days .p.i. Transcript levels are relative to GAPDH × 1000. Data are representative of two independent experiments with similar trends.
