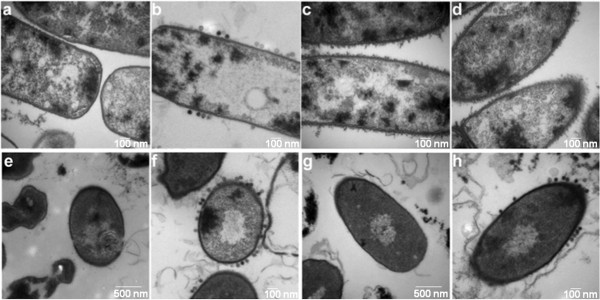
Figure 6.

Transmission electron microscopic images of wt and ∆csaB mutants and the complemented strains.a) BA663 (csaB+); b) BA663+AP50c; c) BAP350 (∆csaB); d) BAP350 (∆csaB)+AP50c; e) BAP533 (csaB+XmaI); f) BAP533+AP50c; g) BAP350 (∆csaB)+ pBGBN 1003 (csaB+); h) BAP350 (∆csaB)+ pBGBN 1003 (csaB+)+AP50c. The scale bar is in the bottom right corner of each figure.
