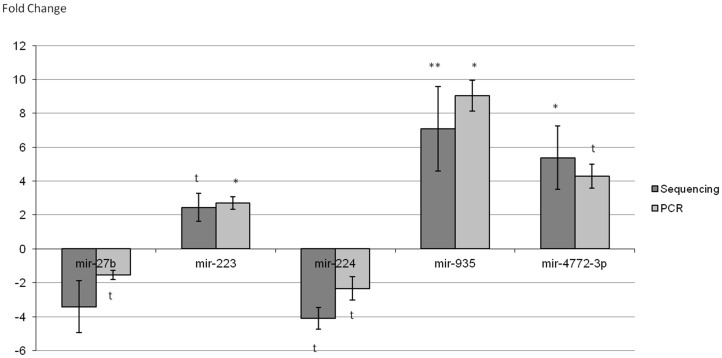
Figure 2. Comparison between the two technologies applied in this work, high-throughput sequencing (dark columns) and RT-PCR (light columns).
The expression of mir-27b, mir-223, mir-224, mir-935 and mir-4772-3p is represented as fold change of non-responders with respect to responders at baseline. The data correspond to the mean ± SEM. Comparisons between groups were made using adjusted P-value (mass sequencing) and Mann-Whitney U test (RT-PCR). *, p<0.05; t, p<0.1.

