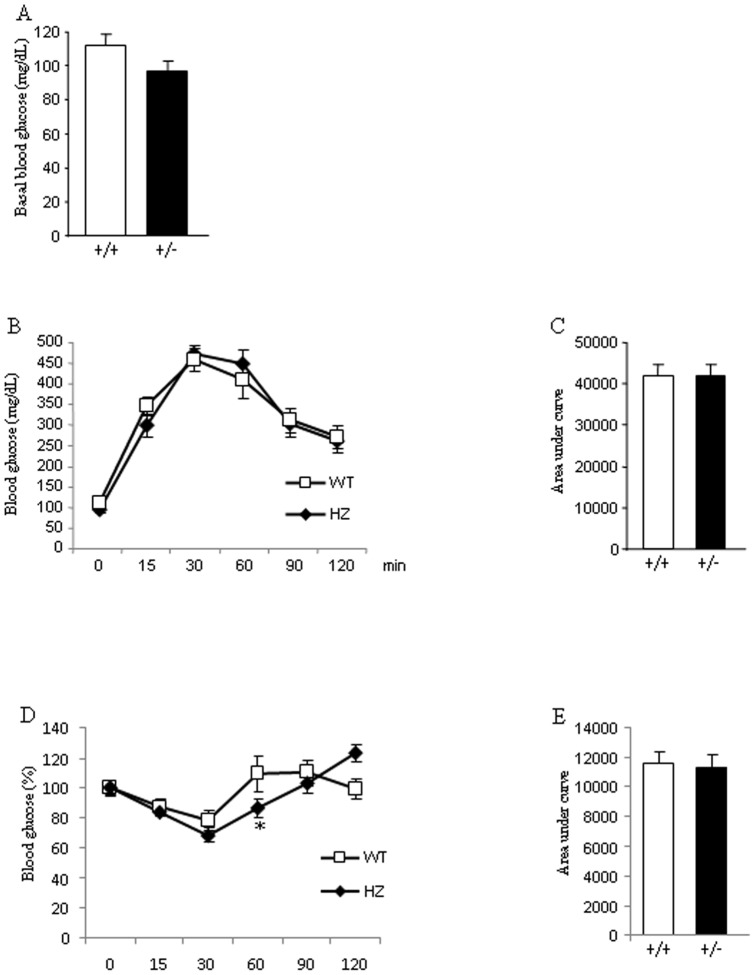
Figure 4. Glucose homeostasis and insulin sensitivity in mice fed a high fat diet.
Basal glucose levels (A), glucose tolerance test (B), respective area under the curve (C), insulin tolerance test (% of glucose levels represented against t0) (D), and respective area under the curve (E) in male wild type (WT) and endoglin heterozygous (HZ) mice fed a high fat diet for 16 weeks. n = 6–8. *p<0.05.

