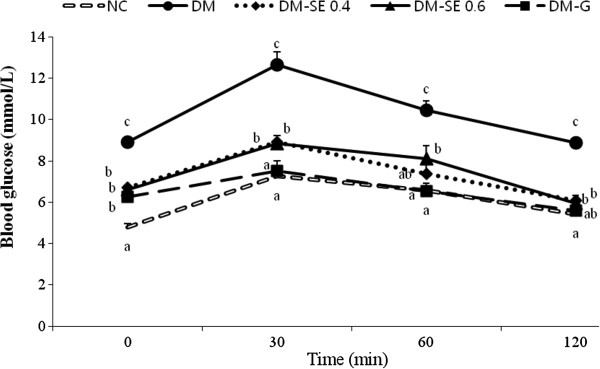
Figure 1.

Blood glucose levels during the intraperitoneal glucose tolerance tests. NC, normal control rats administrated saline; DM, rats with diabetes mellitus administrated saline; DM-SE 0.4, rats with diabetes mellitus administrated 0.4 g/kg body weight of sorghum extract; DM-SE 0.6, rats with diabetes mellitus administrated 0.6 g/kg body weight of sorghum extract; DM-G, rats with diabetes mellitus administrated 0.7 mg/kg body weight of glibenclamide. The values are mean ± SEM (n = 5). Values with different superscripts are significantly different at p < 0.05 using ANOVA with Duncan’s multiple range test.
