
Figure 7. Changes in mean contribution of the glycan group GP1 following zebularine treatment and recovery.
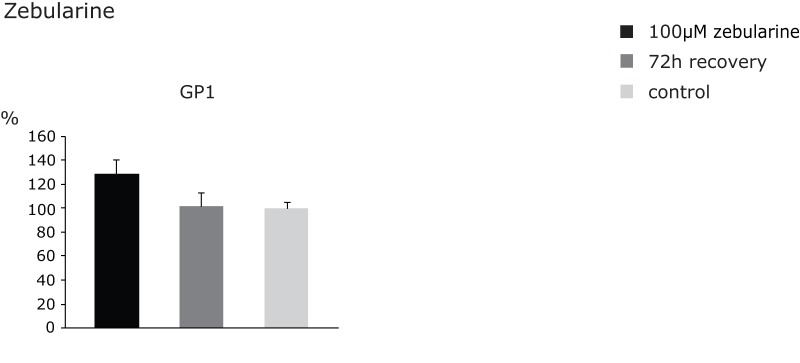
The observed changes were normalized to control values, which were set to 100%. The error bars represent standard deviations obtained on the basis of 4 independent experiments.