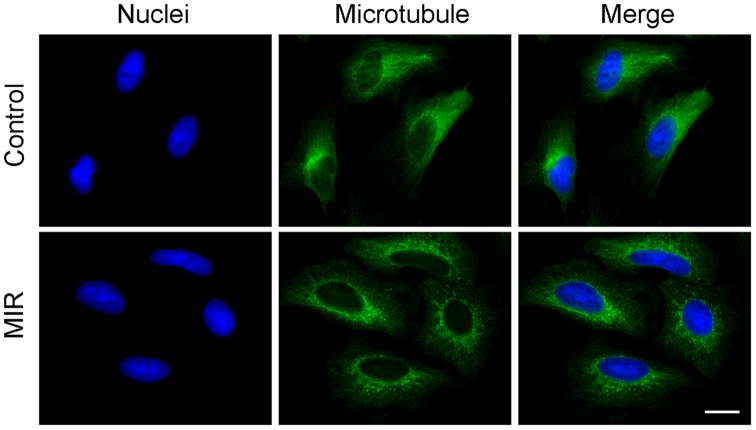
Figure 4. Effect of MIR exposure on the microtubule networks of A549 cells.
Cells were seeded onto glass coverslips in 12-well plates, exposed to MIR for 48 hours, fixed for staining and visualized by fluorescence microscopy. Microtubules were labeled with α–tubulin antibody and the corresponding FITC–conjugated secondary antibody (green), and nuclei were labeled with DAPI (blue). Scale bar represents 10 µm.

