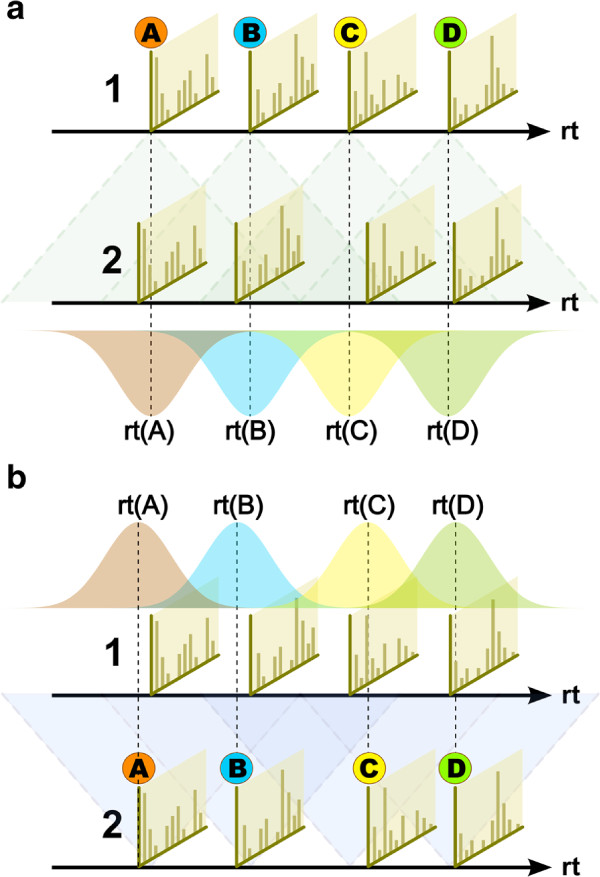
Figure 1.
Schematic of the forward and reverse similarity calculation phase of BIPACE. The hard retention time difference limit is depicted by shaded cones with dashed outline. Individual Gaussian retention time penalty functions are mean centered on each peak’s apex retention time (rt). (a) BIPACE with a Gaussian retention time penalty function for peaks A through D from chromatogram 1 to chromatogram 2. (b) BIPACE with a Gaussian retention time penalty function for peaks A through D from chromatogram 2 to chromatogram 1 (reverse direction).

