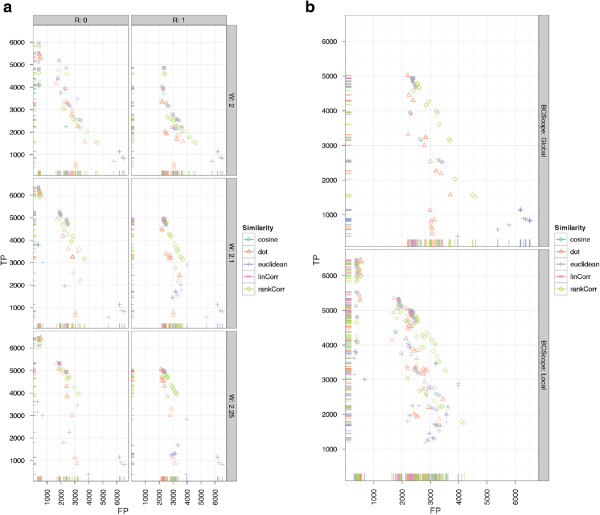
Figure 14.
Scatter plots for CeMAPP-DTW for the wheat dataset with alignment true positives and false positives. SubFigure 14(a) shows alignment true positives and false positives conditioned on anchor radius (columns) and alignment match weight (rows). It is clearly visible that an anchor radius of R = 0 combined with a match weight of W = 2.25 gives the best results for linear correlation and the dot product. SubFigure 14(b) shows alignment true positives and false positives conditioned on Sakoe-Chiba bandwidth constraint BC as relative number of scans (columns). Rows show whether the constraint was applied globally or locally (BCScope). The best results were obtained for a local window of 0.1·max{|A|,|B|}.

