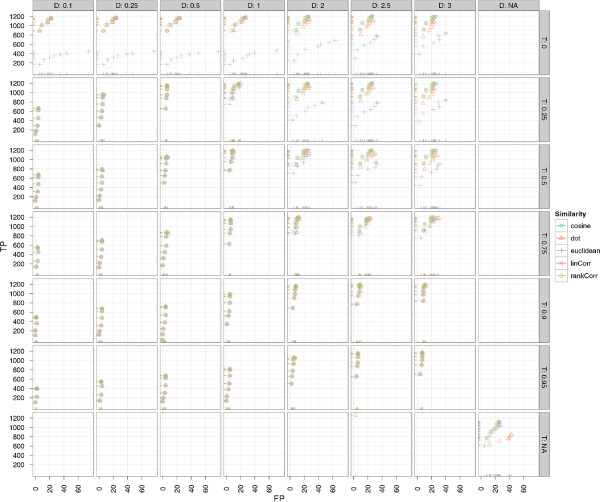
Figure 6.
Scatter plots for BIPACE for the Leishmania dataset with alignment false positives and true positives for the D and T parameters. Scatter plots for BIPACE for the Leishmania dataset with alignment false positives and true positives conditioned on retention time tolerance D (columns) and retention time threshold T (rows). Instances without retention time penalized similarity function are shown in the NA row/column for reference. It is visible that the unpenalized instances perform consistently worse on true positives and false positives.

