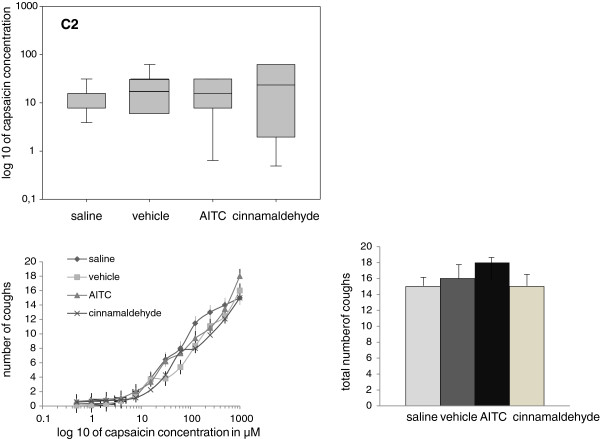
Figure 2.
Upper panel represents the changes of cough threshold - parameter C2. As it could be seen C2 values are not significantly different when comparing data obtained after nasal saline, vehicle, AITC and cinnamaledyde. Cumulative and total cough response obtained during the cough tests after nasal AITC and cinnamaldehyde do not differ from saline and vehicle values (lower panel) (all p>0.05).

