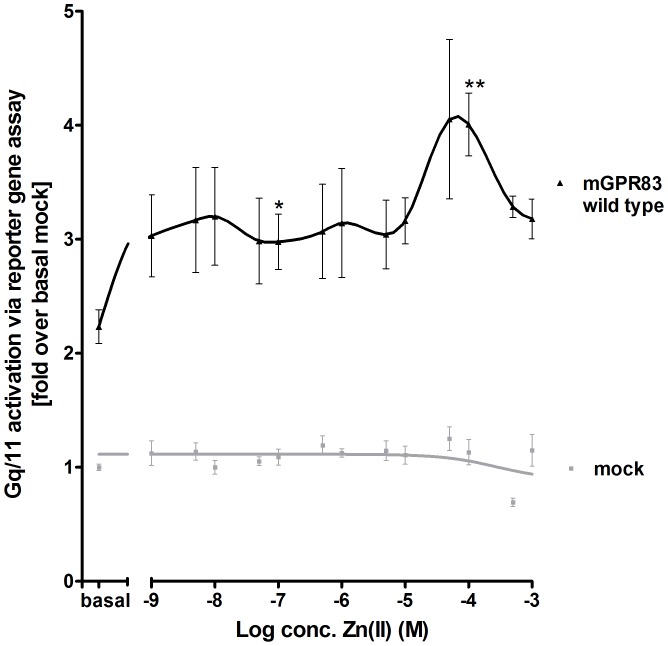
Figure 2. Concentration-response curve of zinc(II)- stimulation at mGPR83.
HEK293 cells were transiently transfected with the empty expression vector pcDps (mock) or pcDps encoding the wild type Gpr83. Two days after transfection, stimulation with 1 nM – 1 mM ZnCl2 was carried out, cells were lysed and IP3-accumulation was measured in a reporter gene assay. The hTSHR stimulated with 100 mU/ml bTSH functioned as assay control [data not shown, [31], [32]. The EC50 value of the wild type mGPR83 is 10.2 ± 1.4 µM zinc(II) and was obtained from the concentration-response curve (1 nM – 1 mM Zn(II)) using GraphPad Prism. First asterisk indicates a significant increase in IP3 formation in comparison to basal wild type. Second asterisks indicate significance in comparison to the first asterisk. Data were evaluated from a minimum of 3 independent experiments, each performed at least in triplicates and calculated fold over the mock transfection, with 24718.3 ± 3958.7 relative light units, set to 1. Shown data represent mean ± SEM. * p<0.05, ** p<0.01 (unpaired t-test, two-tailed).

