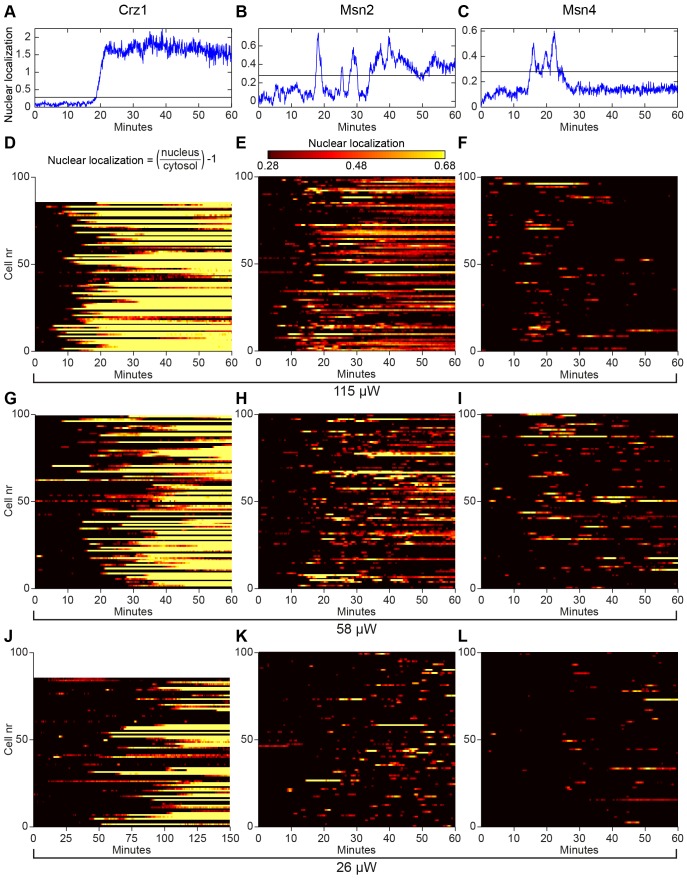
Figure 1. Nucleocytoplasmic localization responses of Crz1p, Msn2p and Msn4p during continuous exposure to blue light.
(A)–(C) Nuclear localization trajectories in a single cell and (D)–(L) temporal nucleocytoplasmic localization profiles for populations of 80–100 cells extracted from fluorescence microscopy images for Crz1-GFP (left column), Msn2-GFP (middle column) and Msn4-GFP (right column) at three different light intensities (rows). (A)–(C) The horizontal line represents the threshold used for determining nuclear localization. (D)–(L) Nuclear localization (colour scale) visualizes the relative fluorescence intensity between the nucleus and the cytoplasm in individual cells ((Inucleus/Icytosol)−1). Crz1p permanently entered the nucleus in a comparatively uniform fashion throughout the whole cell population and exhibited occasionally only one or two oscillations in some cells prior to permanent nuclear localization (A, D, G, and J). Note the different time scale in (J). Msn2p and Msn4p exhibited nucleocytoplasmic oscillations, where the oscillatory response of Msn2p was much more pronounced. A subpopulation of cells showed permanent Msn2p nuclear localization after a period of oscillations (mainly seen in B and E).

