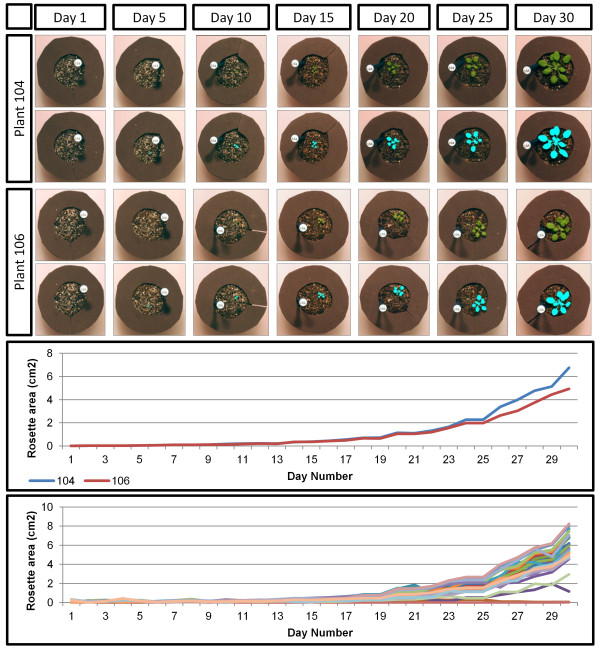
Figure 1.
Example results from the growth experiment. The top panel includes normalized and processed images for two plants at five-day intervals. The middle panel shows the growth curves for those two example plants, showing the ability to distinguish between individual curves within genotypes. The bottom panel shows the growth curves for all 60 plants in the experiment.

