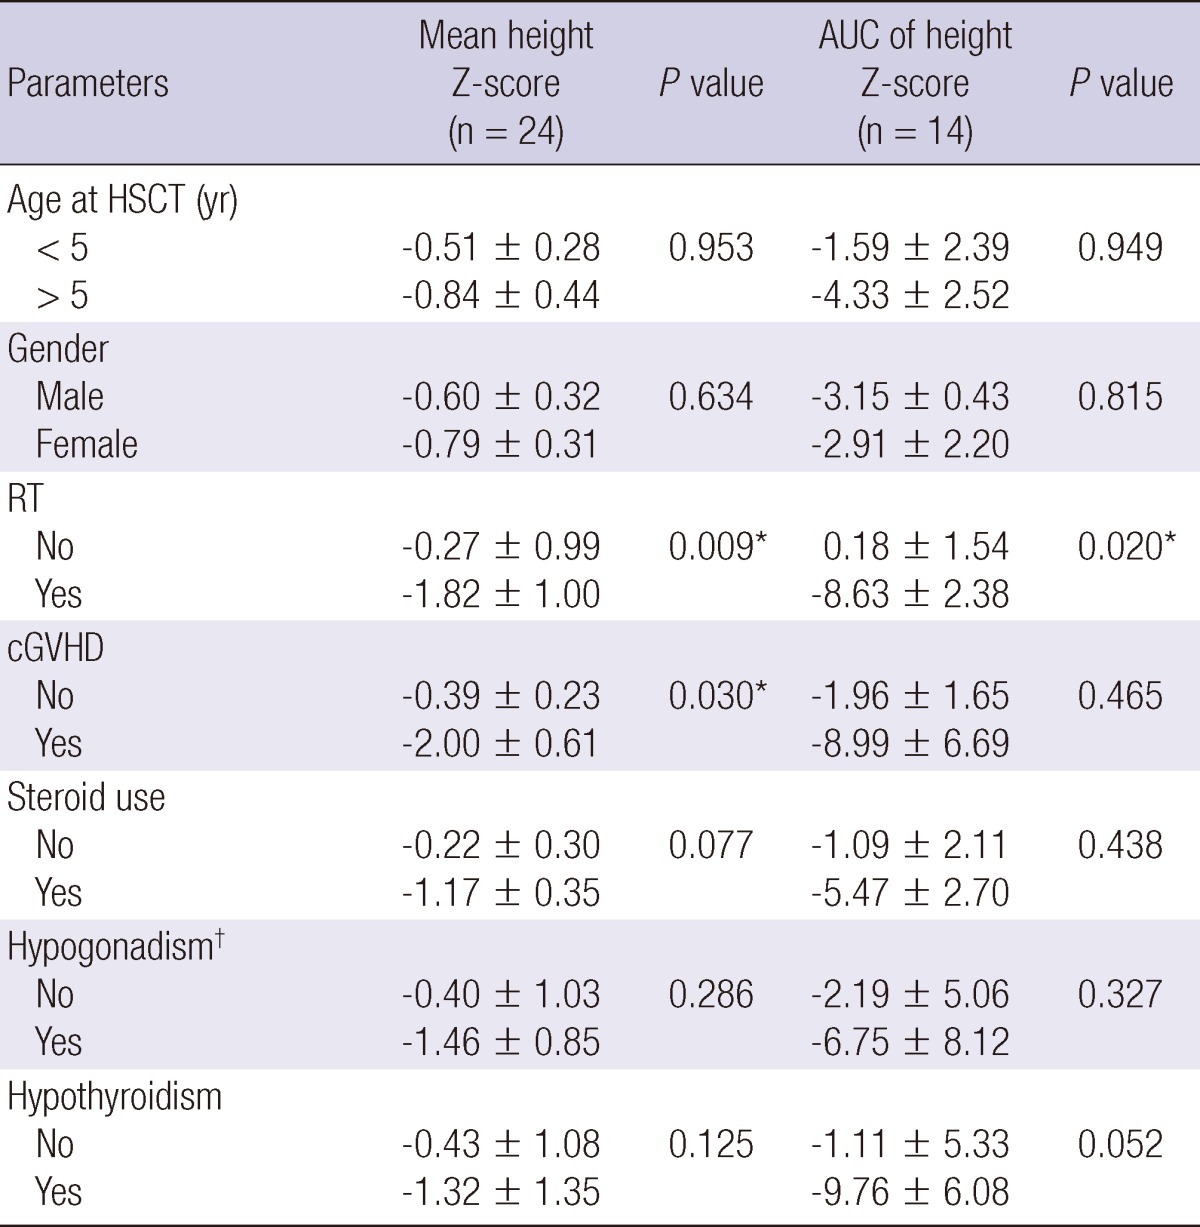
Table 2.
Summary measure analysis of growth 5 yr after HSCT (Group 1)

Mean data were expressed as mean ± standard deviation (SD). *Statistically significant difference; †Total subject number was 10 for analysis of hypogonadism. HSCT, hematopoietic stem cell transplantation; AUC, area under curve; RT, radiotherapy; cGVHD, chronic graft-versus-host disease.
