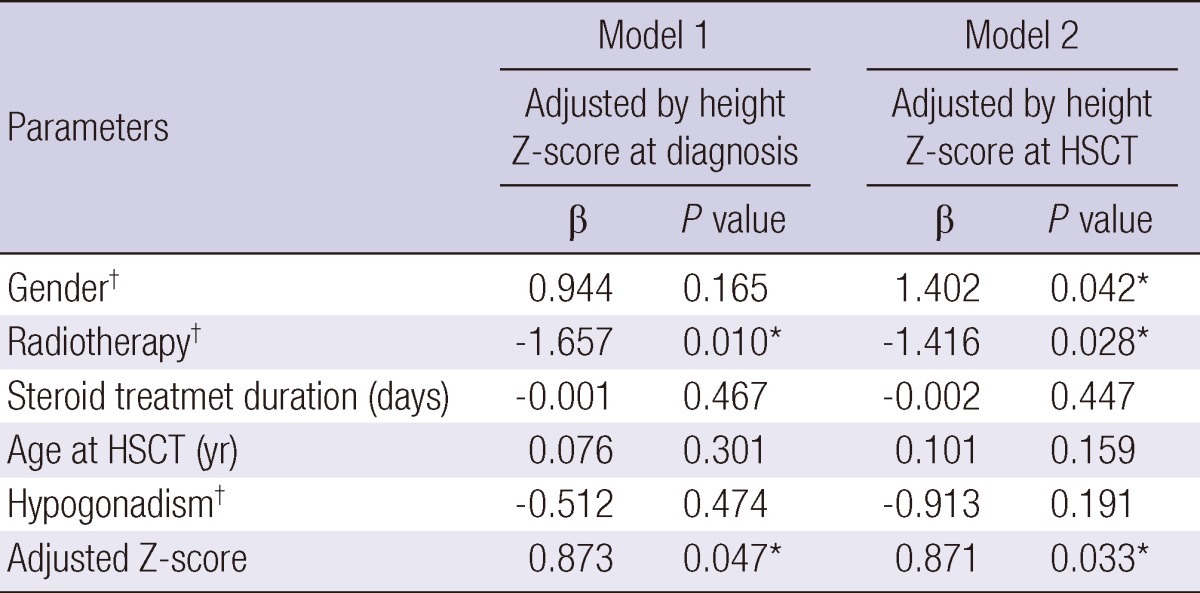
Table 3.
Factors influencing the final adult height Z-score

Model 1 was adjusted by height Z-score at diagnosis, Adjusted R square = 0.578; Model 2 was adjusted by height Z-score at HSCT, Adjusted R square = 0.599. *Correlation was statistically significant. †Following values were entered in the models. Gender; male = 0, female = 1, Radiotherapy; no = 0, yes = 1, Hypogonadism; no = 0, yes = 1. HSCT, hematopoietic stem cell transplantation.
