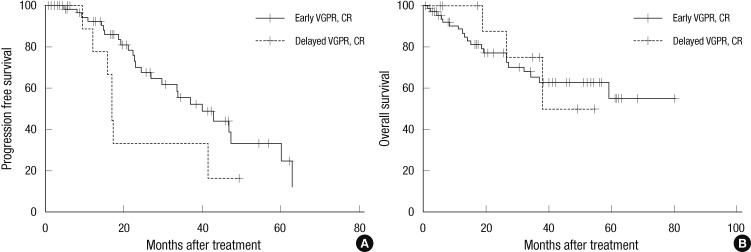
Fig. 2.
Comparison of progression free survival (PFS) and overall survival (OS) rates between the early and delayed response groups. The early response group has a higher PFS (P = 0.031) (A). There is shown no difference between the groups in terms of OS (P = 0.831) (B). CR, complete response; VGPR, very good partial response; PR, partial response; SD, stable disease; PD, progressive disease.

