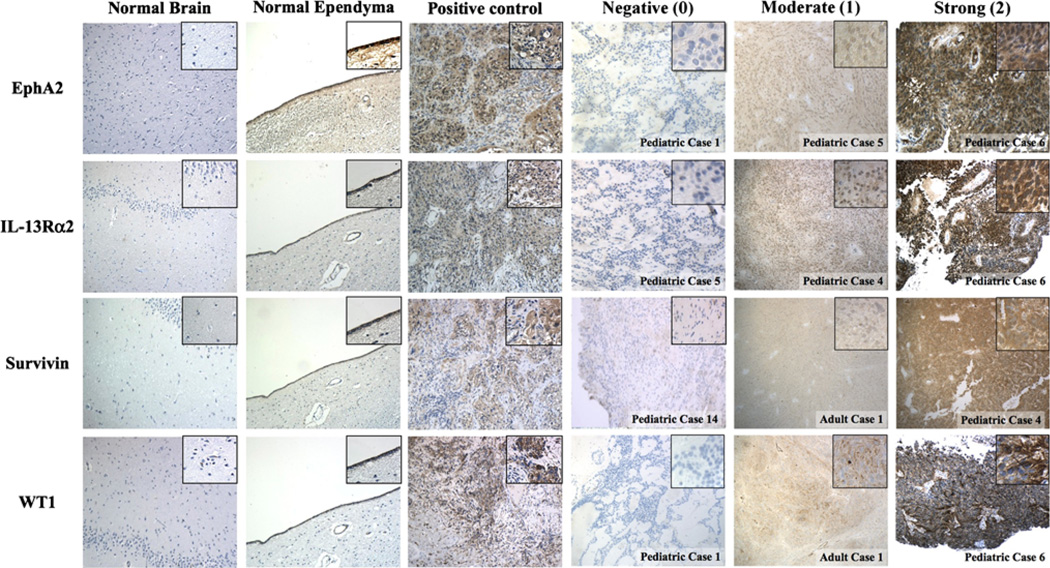
Fig. 1.
Immunohistochemical analysis of EphA2, IL-13Rα2, Survivin, and WT1 in normal brain (negative control), normal ependyma, glioblastoma (positive control), and ependymoma. Cases representative of different staining intensity for each TAA are shown. The final score was determined by using the intensity representative of more than 50 % of the tumor cells. Images at original magnification (100×) are shown with high power insets (400×) derived from the corresponding low power fields

