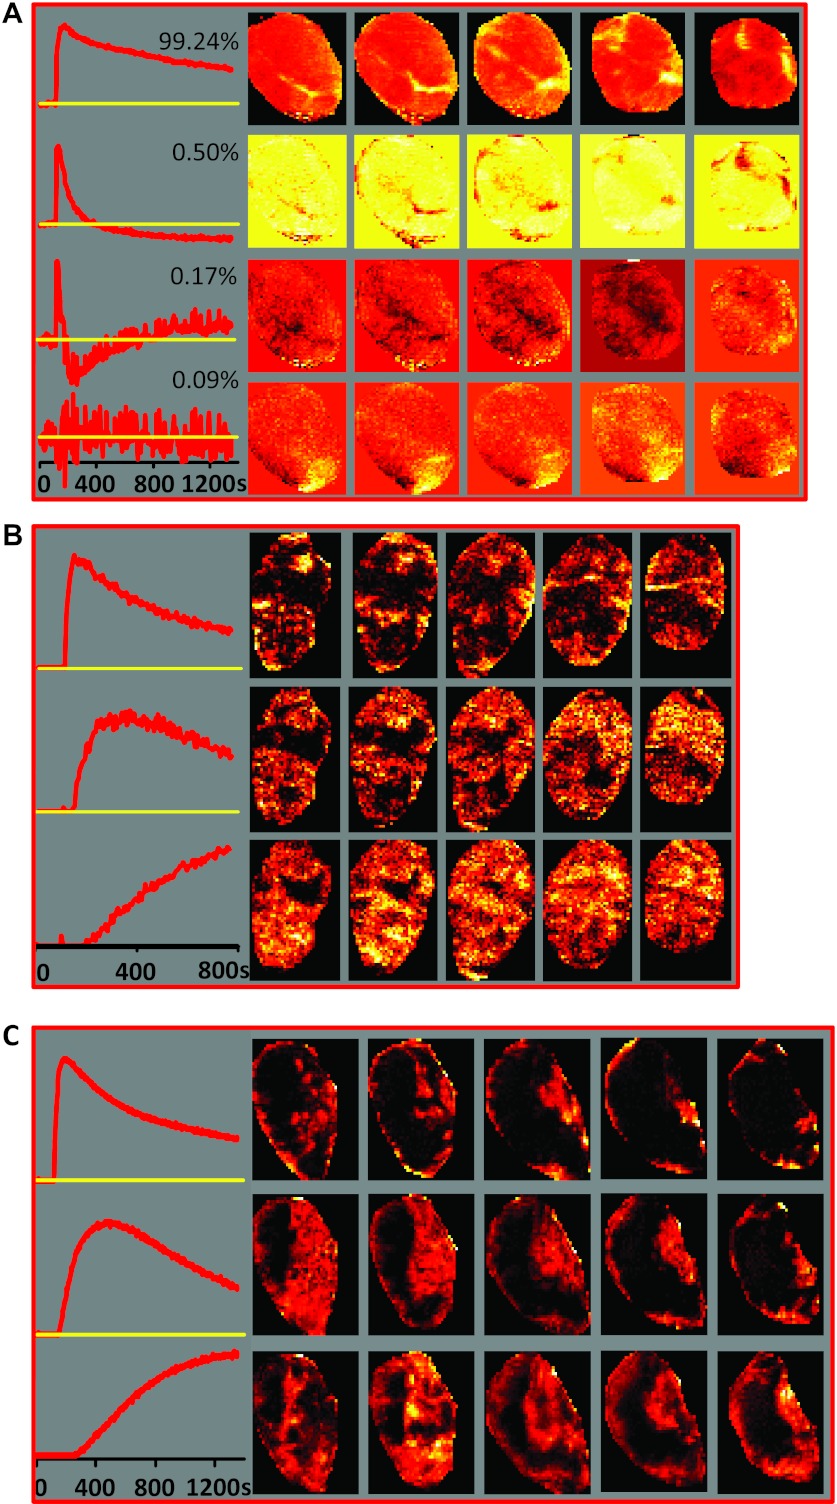
Figure 2.
PR analysis. (A) Left: First four PCs from DCE-MRI data from the smallest tumor A in the analyzed series (478 mm3). The first PC explains more than 99% of the variability, suggesting high level of homogeneity in the tumor microenvironment. Right: Spatial distribution of the magnitude of the corresponding PC scores in the five tumor slices. (B) cNMF applied to DCE-MRI data from tumor C (870 mm3). Only the first 145 time points from the DCE series (∼775 seconds) were analyzed, as PCA analysis of this tumor (data not shown) indicated that there was an interruption in the PC curves around the 145th time point, possibly because of movement. Left: Basic signal versus time curves S(t). Right: Spatial distribution of the corresponding weights W in the five tumor slices. (C) cNMF applied to DCE-MRI data from tumor D (1230 mm3). Left: Basic signal versus time curves S(t). Right: Spatial distribution of the corresponding weights W in the five tumor slices.

