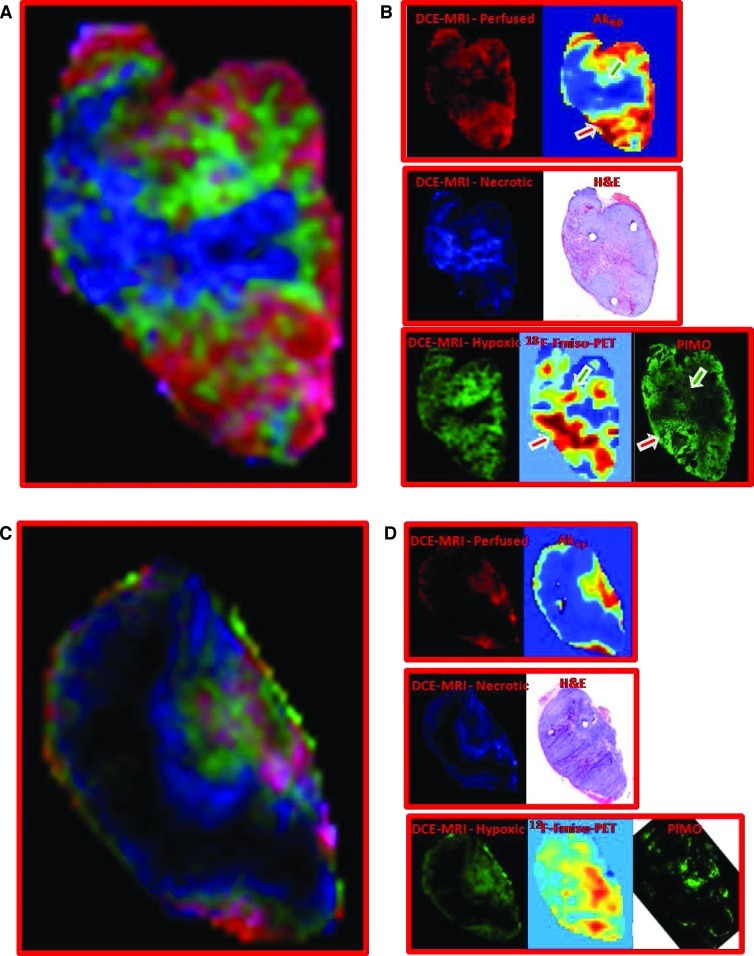
Figure 3.
Correlation of contrast agent uptake patterns as determined by PCA/cNMF analysis of DCE-MRI data to tissue microenvironments as determined by other imaging modalities. (A, C) Composite color images of signal versus time patterns (cNMF curves) in individual tumors B (A, tumor volume = 744 mm3) and D (C, tumor volume = 1230 mm3). The colors represent the weights of the first (red), second (green), and third (blue) cNMF curves, as displayed in Figures 1D and 2C for the two tumors, respectively. (B, D) The spatial distribution of the three temporal patterns compared to the spatial distribution of well-perfused, hypoxic, and necrotic areas, respectively, as identified previously by other imaging modalities [6]. The red cNMF map agrees well with the corresponding Akep map estimated from the DCE-MRI data and represents well-vascularized areas. The blue pattern, including the black core of the tumor, overlaps with the areas of necrosis, as determined from corresponding H&E-stained tissue sections. The hypoxic areas in these tumors previously obtained from the late 18F-Fmiso slope data (in vivo) and pimonidazole-stained tissue sections (ex vivo) [6] correspond well to the distribution in the green map. Green and red arrows indicate hypoxic areas adjacent to necrotic and well-vascularized areas, respectively. 18F-Fmiso maps, as well as the images of the H&E- and pimonidazole-stained tumor tissue sections, were adapted with permission from Cho et al. [6].

