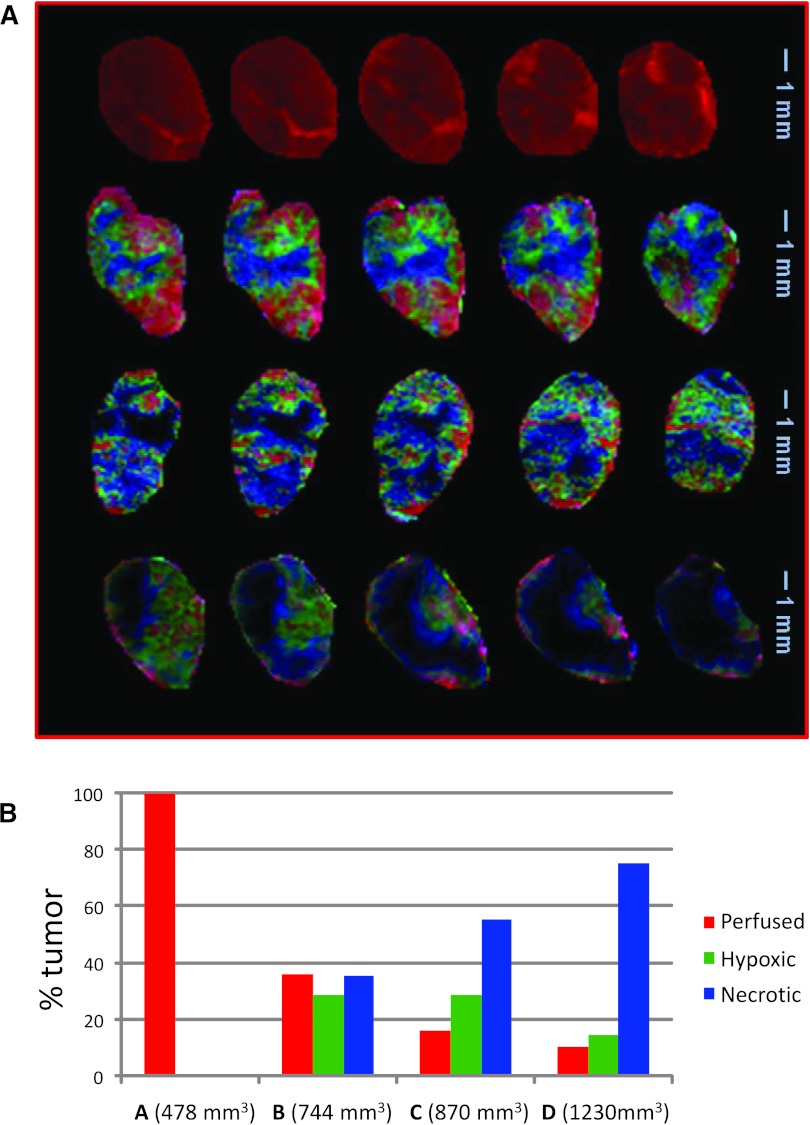
Figure 4.
Summary of PR analysis. (A) Composite color images of individual tumor subtissue features, as identified by PR analysis. The presented images in the five slices in tumors A, B, C, and D refer to perfused (red), hypoxic (green), and necrotic (blue/black) tissues. Note that the black areas adjacent to the blue voxels are also part of the necrotic core. The tumor sizes are 478 mm3 (A), 744 mm3 (B), 870 mm3 (C), and 1230 mm3 (D). (B) Fractions of the three tissue features in the four tumors.

