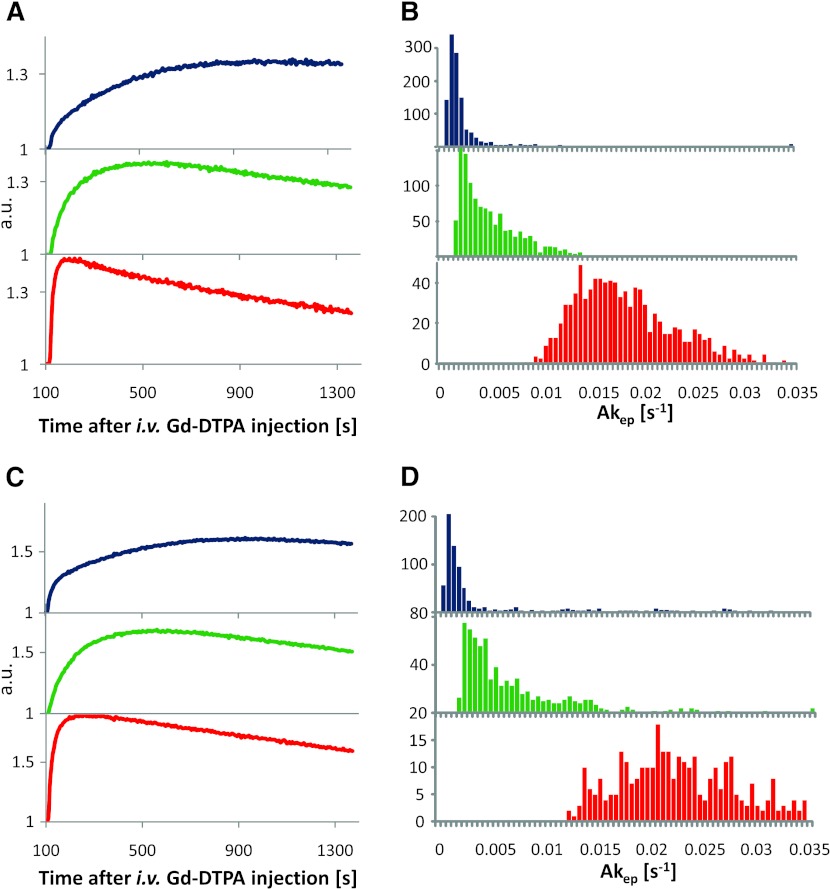
Figure 5.
Pharmacokinetic analysis of DCE-MRI curves. (A, C) Average signal versus time curves (normalized to the pre-contrast series) from pixels of predominantly blue (necrotic), green (hypoxic), and red (perfused) areas from tumors B (744 mm3) and D (1230 mm3). (B, D) Corresponding histograms of Akep values in the three types of tissues as identified by unsupervised PR analysis of DCE-MRI data. Note that in these types of quantification the tumor areas that show no contrast uptake, as well as pixels falling outside of the highest quartile for well-perfused, hypoxic, or necrotic weights W, respectively, were excluded.

