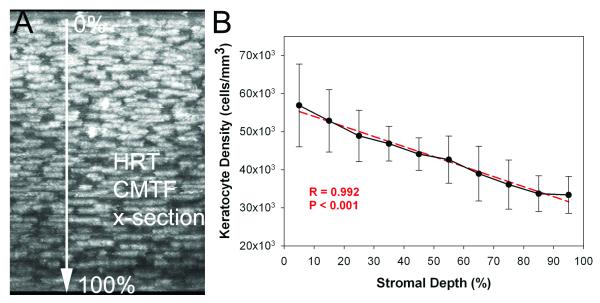
Figure 5.
A) Maximum Intensity Projection along the x-axis of an in vivo image stack collecting using the CMTF program. B) Graph showing mean cell densities through the stromal thickness of six corneas. Both the image and the graph show progressively decreasing cell density through the stroma from the basal lamina to the endothelium. Graph shows mean and standard deviation of measurements from six corneas taken in vivo (N=6).

