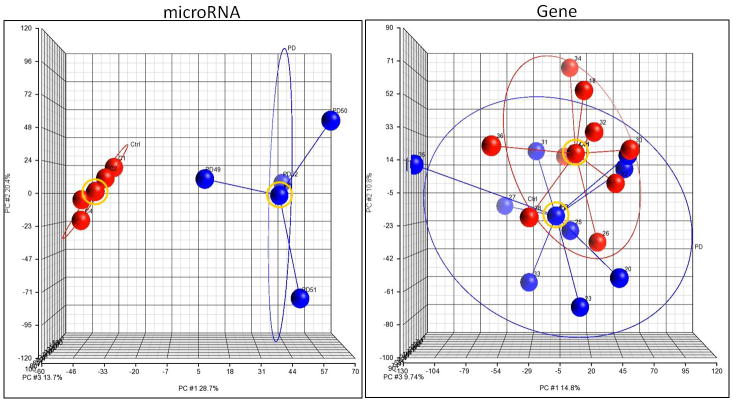
Figure 1. Principal Component Analysis of individual animals for the miRNA and mRNA array.
The post-dependent animals are denoted by the blue circles, and the control animals are denoted by the red circles. The ellipse surrounding the two treatment groups identifies variation in mRNA and miRNA expression patterns among samples no more than 2 standard deviations away from the mean. The lines connect to a centroid (denoted by a blue or red ball circled in yellow) to connect similar groups. The x, y, and z axes represent the first 3 largest variable principle components (PC#1, PC#2, and PC #3) accounting for the majority of the variance within the dataset. The left panel represents the miRNA PCA analysis and the right panel represents the mRNA (gene) PCA analysis.

