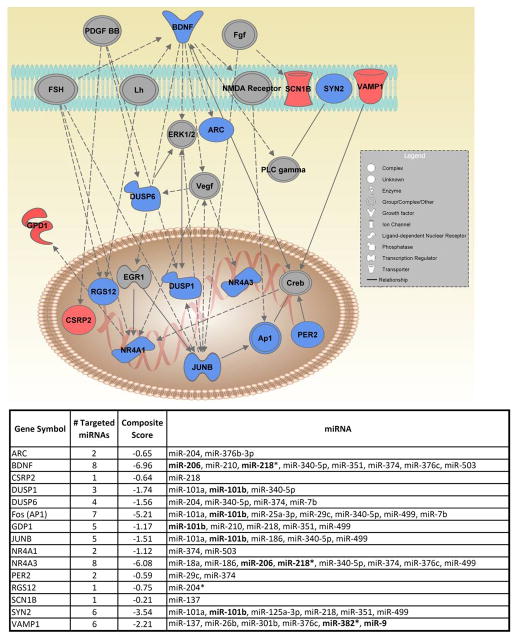
Figure 3. Regulatory Network of Genes altered by alcohol Dependent mRNAs and their targeted miRNAs.
A) Represents a gene regulatory network constructed from the alcohol-dependent mRNA set Edges (lines) connecting nodes (genes) represent regulatory interactions such as regulation of gene expression, protein-protein interactions, protein-nucleic acid interactions, protein- hormone interactions. Up regulated genes are indicated in red, unchanged in gray, and down regulated in blue. Bold lettering represents PCR confirmed genes or miRNAs. B) Represents 13 genes in (A) targeted by miRNAs within the array dataset. * represents the microRNA passenger strand: star composite scores were compiled from Supplemental Table 7. Bold lettering represents PCR confirmed genes or miRNAs. Refer to Supplemental Table 3 & 4 for p-values and fold change for each miRNA and mRNA displayed here.

