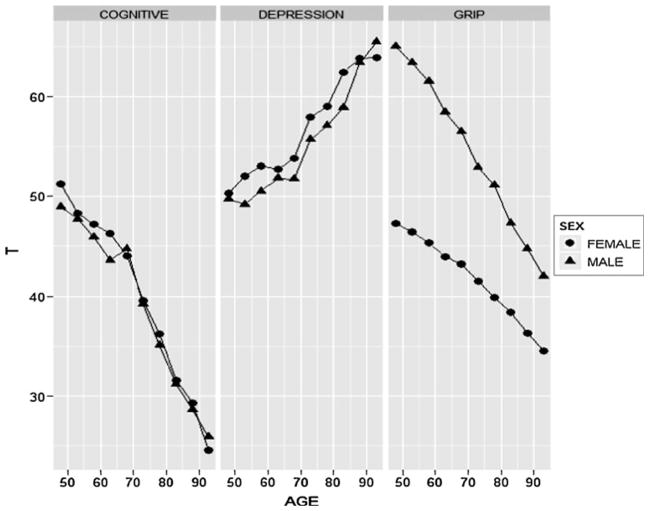
Fig. 1.
Mean outcome score as a function of age. Plotted are mean scores for 5-year intervals ranging from 45–50 to 91–96. Scores are scaled to have a mean of 50 and SD of 10 in the youngest age group (i.e., a T-score metric). In all sex-age group combinations except males in the oldest age group, standard error of the mean is less than 1 point. For males in the oldest age group, standard error of the mean was between 1 and 2

