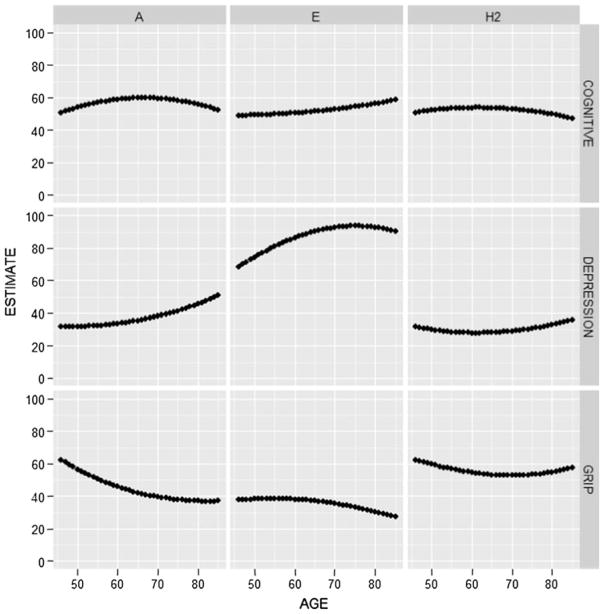
Fig. 3.
Estimates of additive genetic (A), non-shared environmental (E), and heritability (H2) as a function of age for the three outcomes. To facilitate comparisons across the estimates, total phenotypic variance was scaled to equal 100 in the youngest age for each outcome. Estimates are based on the AE model with full age moderation (model 3 in Table 4). Only for grip strength is there evidence of significant age differences in the variance component estimates

