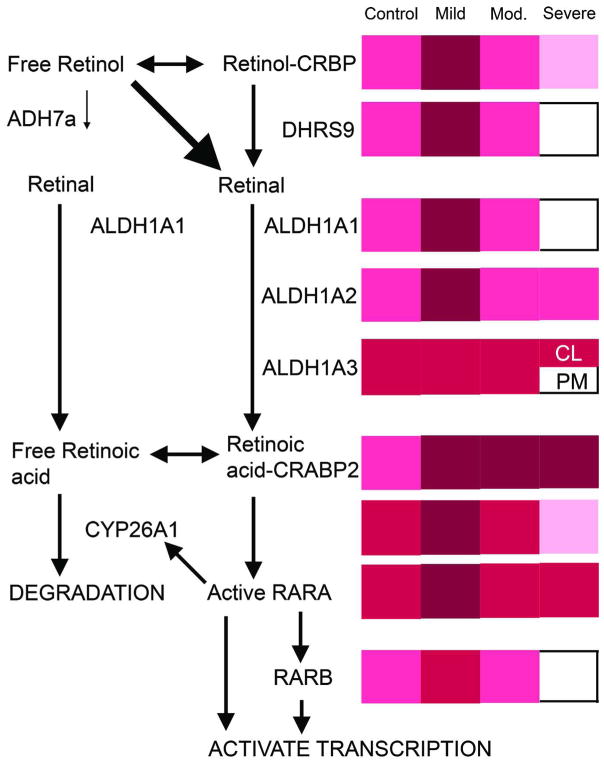
Figure 3. Overview of retinoid metabolism and how these proteins changed during the progression of cicatricial alopecia.
The left shows a schematic of RA synthesis, degradation, and signalling pathways in B6 mice. The right shows a summary of IHC results in chow fed B6 mice with no (control), mild, moderate, or severe disease. Immunoreactivity intensity ranges from dark to light; very strong (maroon), strong (red), moderate (hot pink), mild (pink), or undetectable (white). CL= companion layer, PM= premedulla.

