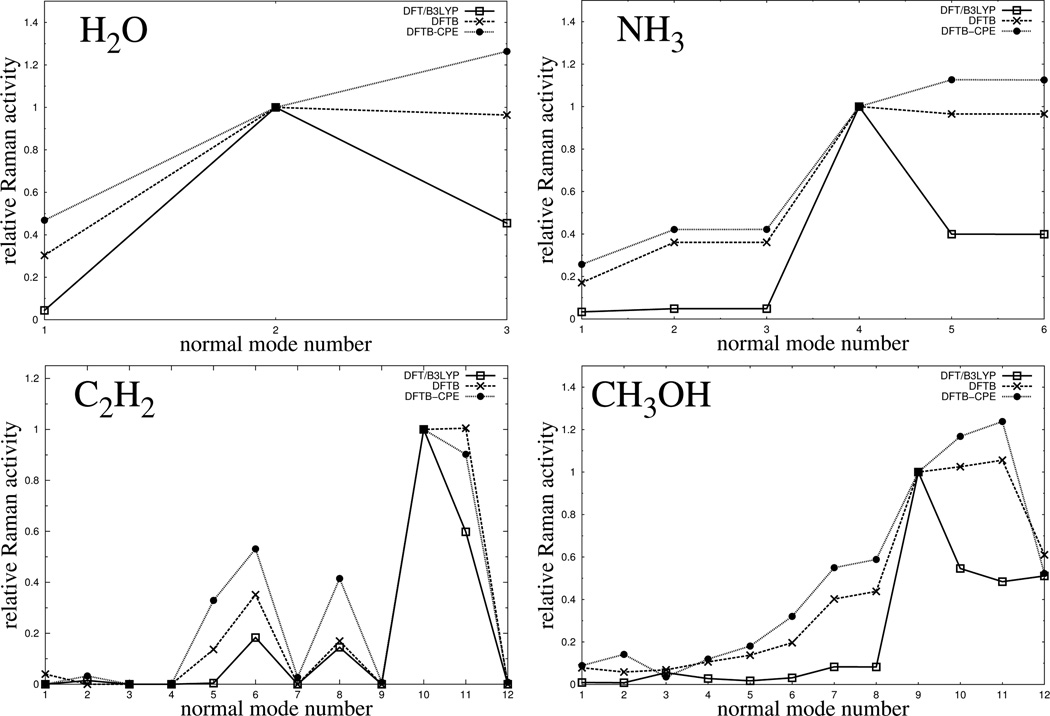
Figure 10.
Comparison of calculated Raman activities, plotted against the normal mode number, for 4 small sized molecules and different levels of theory. Here, the normal mode number denotes a vibrational mode being of the same character for both levels of theory (DFT and DFTB3), increasing from low to high energies (vibrational frequencies). All graphs for a specfic molecule are normalized to unity with respect to the activity of a certain vibrational mode. In particular, mode 2 for H2O, mode 4 for NH3, mode 10 for C2H2 and mode number 9 for CH3OH.

