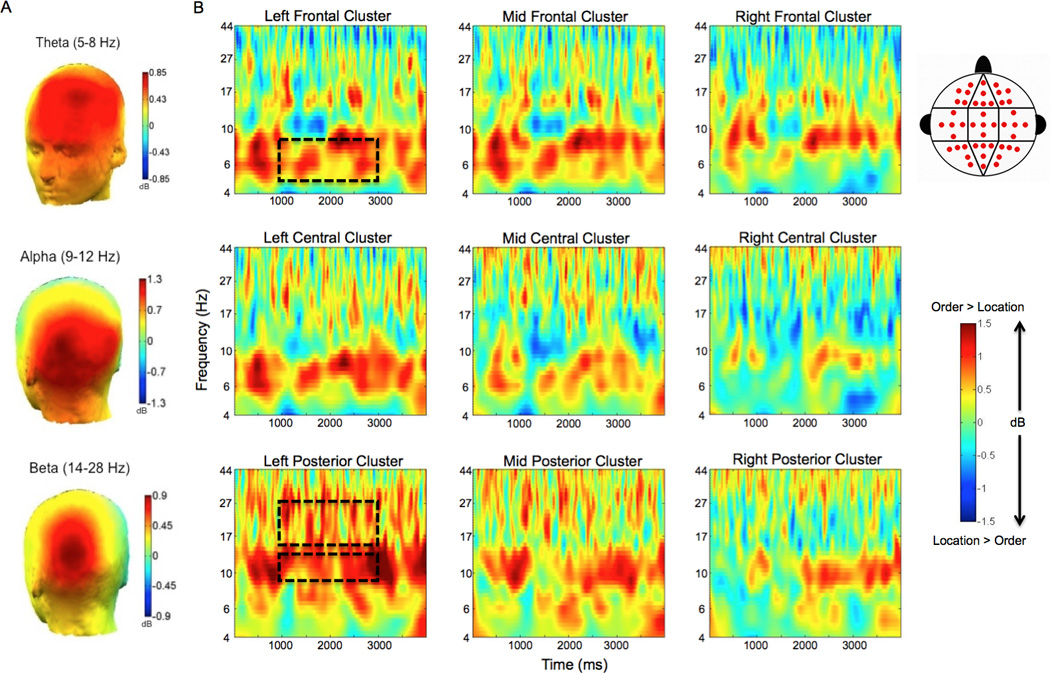
Figure 2.

Theta, alpha, and beta oscillations are enhanced during maintenance of temporal order relative to maintenance of spatial location. A. Topographic maps of the difference in oscillatory power between correct order and correct spatial location trials are shown in theta (5–8 Hz; top), alpha (9–12 Hz; middle), and beta (14–28 Hz; bottom) frequency bands during the delay period. B. Averaged time-frequency spectrograms of the temporal – spatial power difference are shown across all electrode clusters. The distribution of electrode sites is depicted in the cluster map within the legend. Time (ms) during the delay period is plotted on the x-axis and frequency (log scale) is plotted on the y-axis. These plots display activity throughout the entire duration of the delay period. Time zero indicates the offset of the final encoding stimulus, and the last time point (4000 ms) represents the offset of the delay period fixation cross. Warm/hot colors represent enhanced power in temporal order trials as compared to spatial location trials, whereas cool/cold colors represent enhanced power in spatial location trials as compared to temporal order trials. Dashed boxes highlight the effects observed in the theta band at left frontal electrode sites, and the alpha and beta effects at left posterior electrode sites. Dashed boxes also reflect the time window used in statistical analyses (from 1000 – 3000 ms).
