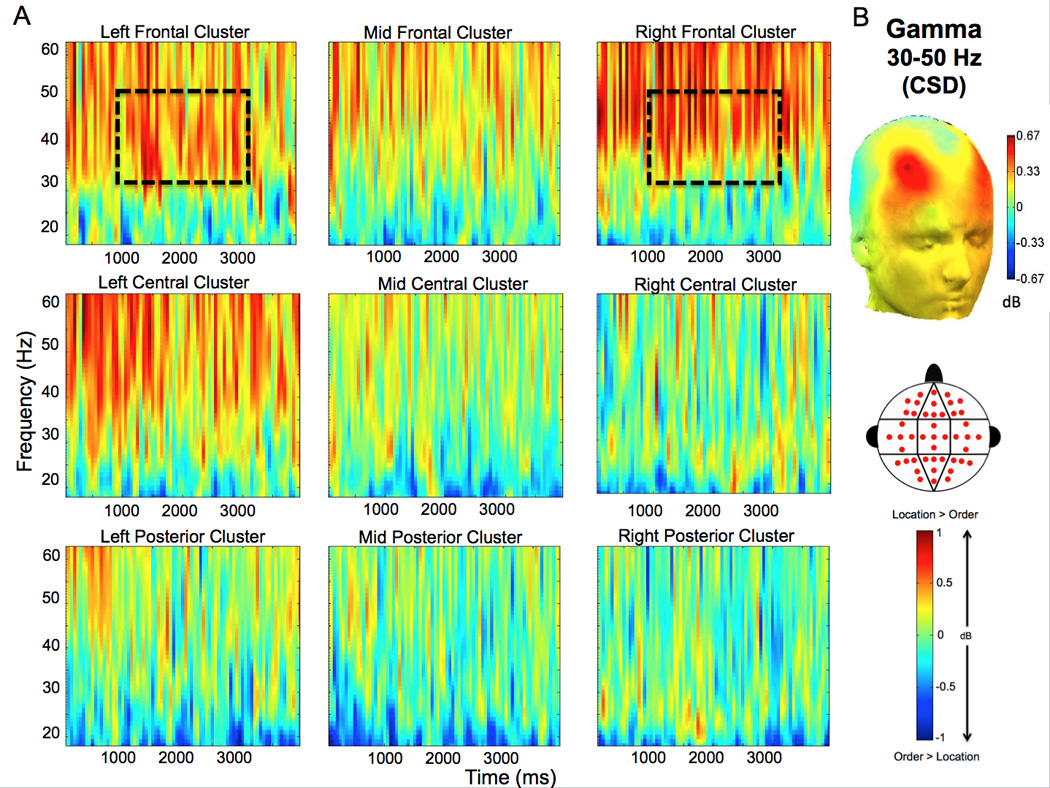
Figure 4.

CSD demonstrates enhancement of gamma oscillations in spatial trials relative to temporal trials. A. The averaged time-frequency spectrogram (calculated from analyses of CSD waveforms) of the spatial – temporal power difference is shown across all electrode clusters (see the cluster map in the legend for the distribution of electrode sites for all clusters). Time (ms) during the delay period is plotted on the x-axis; frequency is plotted on the y-axis. Warm/hot colors represent enhanced power in spatial location compared to temporal order trials. Enhanced gamma (30–50 Hz) effects are highlighted in the dashed box, and represent the frequency band and time window (1000–3000 ms) used in statistical analysis. B. The topographic map of the difference in oscillatory power between correct spatial and correct temporal trials is shown in the gamma (30–50 Hz) frequency band during the delay period. Warm/hot colors represent enhanced power in spatial location compared to temporal order trials.
