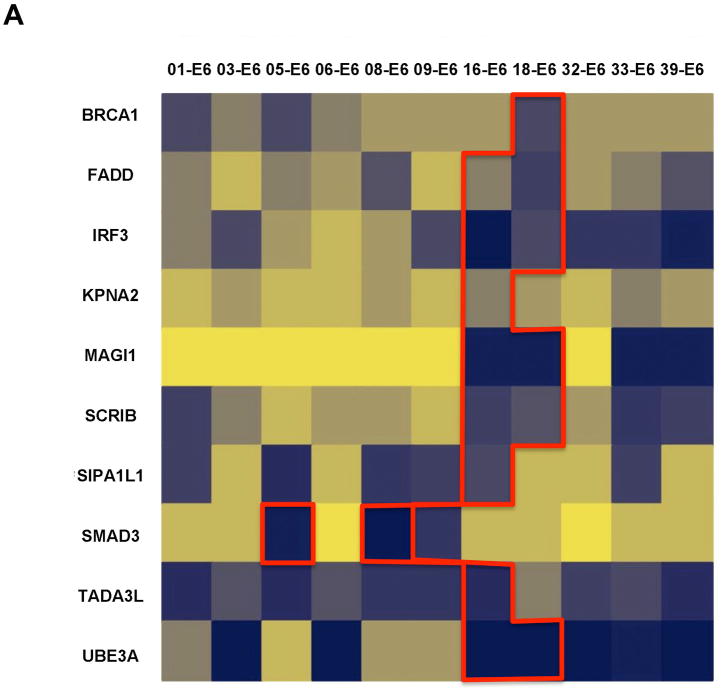
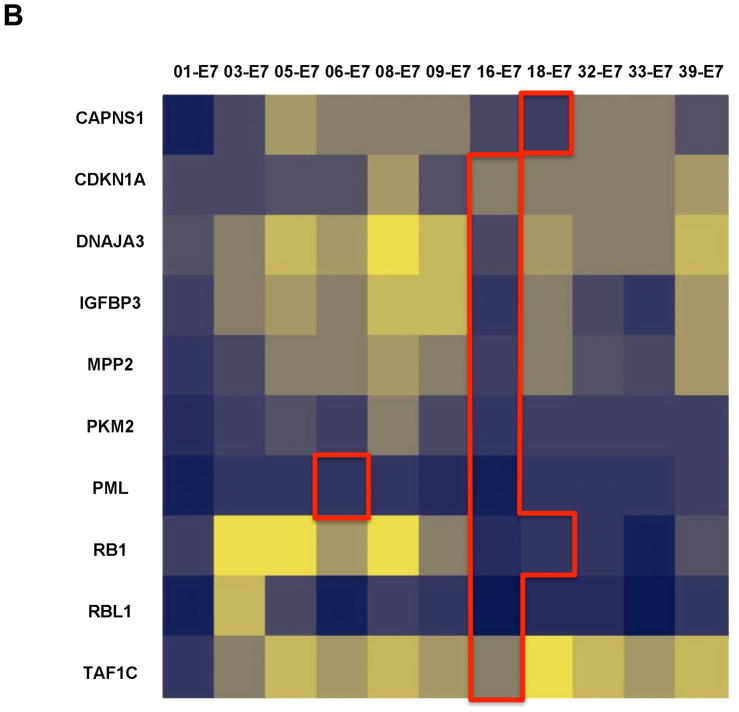
Fig. 4.
Heat maps representing interaction profiles obtained with HT-GPCA for E6 and E7 using the Gold-Standard (GS) dataset. Interaction matrix of E6 (A) or E7 (B) from 11 genotypes were tested with HT-GPCA against two reference sets of cellular proteins. Normalized Luminescence Ratio (NLR) as determined by HT-GPCA and ranging from strong to null interactions is displayed on a blue to light yellow scale. Each column displays the interaction profile for a single HPV genotype (top), with cellular targets corresponding to literature-curated interactions (LCI) designated by their HUGO Gene Symbol (left). The current knowledge area corresponding to LCI is delimited by red lines.


