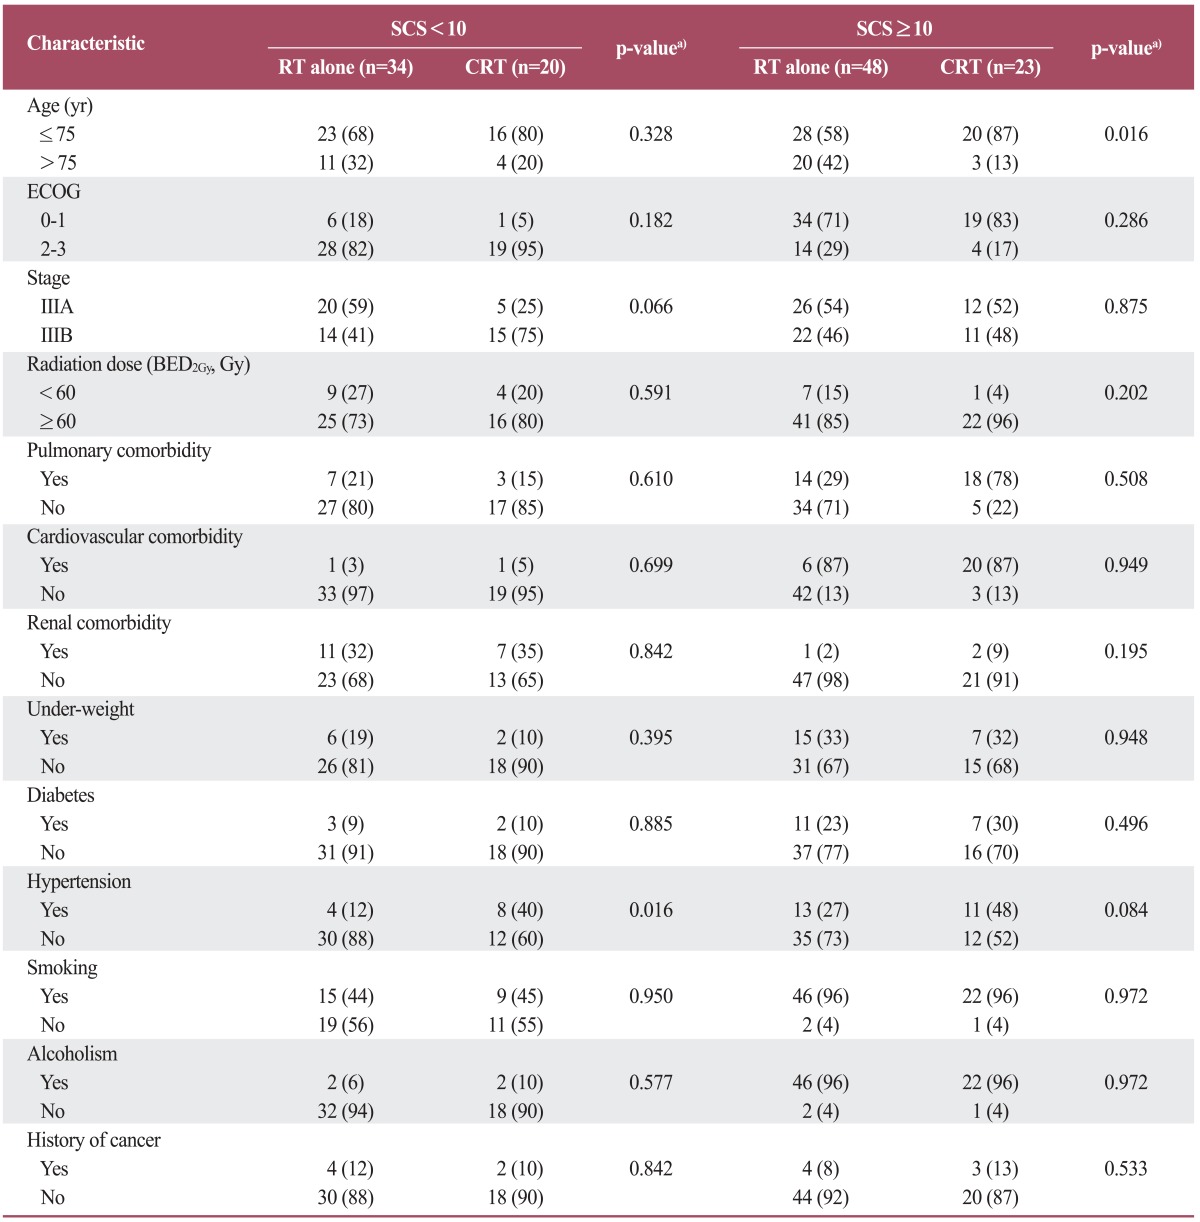
Table 3.
Distribution of patient characteristics

Values are presented as number (%). SCS, simplified comorbidity score; RT, radiotherapy; CRT, chemoradiotherapy; ECOG, Eastern Cooperative Oncology Group; BED2Gy, biologically equivalent dose in 2-Gy fractions using a linear quadratic model and the α/β ratio was 10 for acute effects on normal tissues and tumors. a)Chi-squared test.
