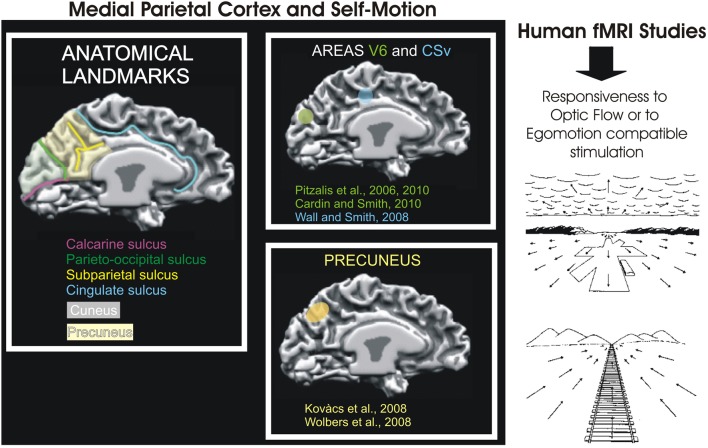
Figure 8.
Medial Parietal Cortex and Self-Motion. Left: Schematic representation of motion-related areas within the human superior parieto-occipital cortex in some fMRI studies. Activation foci are shown on the medial surface of one representative subject's left hemisphere. The cortical surface was defined at the gray-white matter border and has been partially inflated to reveal regions within the sulci (concavities, in dark gray) and on the gyri (convexities, in light gray). Foci are schematically represented based on their sizes and anatomical locations relative to the parieto-occipital, calcarine, and cingulate sulci, as depicted in figures from the original studies: V6 (green), retinotopy (Pitzalis et al., 2006) and function (Cardin and Smith, 2010; Pitzalis et al., 2010); CSv (light blu) (Wall and Smith, 2008) and Precuneus (yellow) (Kovács et al., 2008; Wolbers et al., 2008). Modified from Culham et al., 2008. Right: Examples of retinal optic flow. Expanding optic flow during forward motion. Panel shows a typical retinal optic flow during a landing. The landing field, the mountains and the clouds are visible. Contracting optic flow during inward motion. Panel shows a typical retinal optic flow seen by an observer sitting on a moving train and looking in the opposite direction respect to the motion direction of the train. In both panels, the arrows indicate the optic flow direction. The arrows length is proportional to the speed of motion. Modified from Bruce et al. (1996).

