
Figure 9.
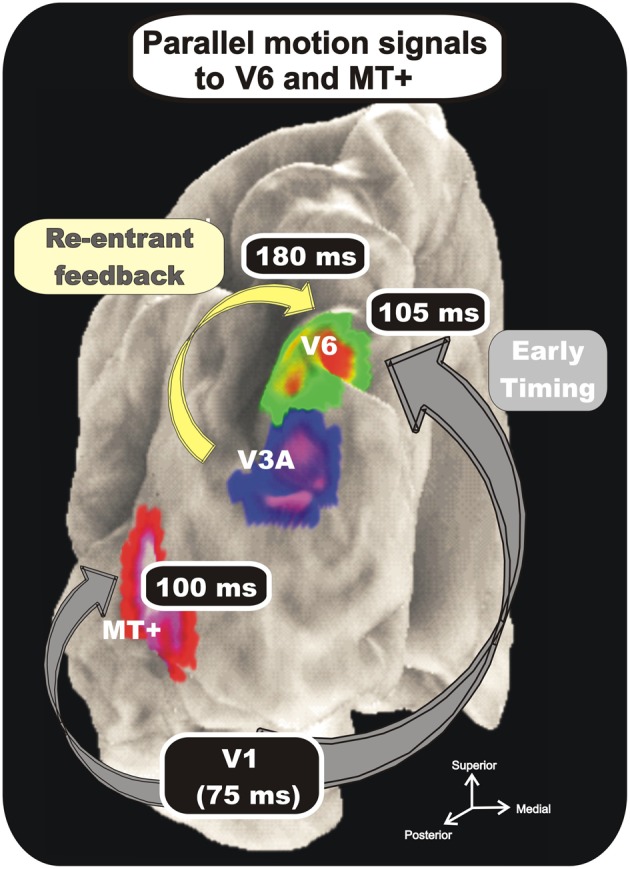
Combination of VEP and fMRI data. Group-averaged Imaging results. Regions more activated in the coherent or incoherent motion conditions (contrasts C-I and I-C) are indicated on the cortical surface using text labels (V6, V3A, and MT+) together with labels about their response timing. Results are displayed together on the semi-inflated cortical surface reconstruction of the left hemisphere of the average brain. Numbers indicate time of occurrence of VEP signals. Modified from Pitzalis et al. (2012b).