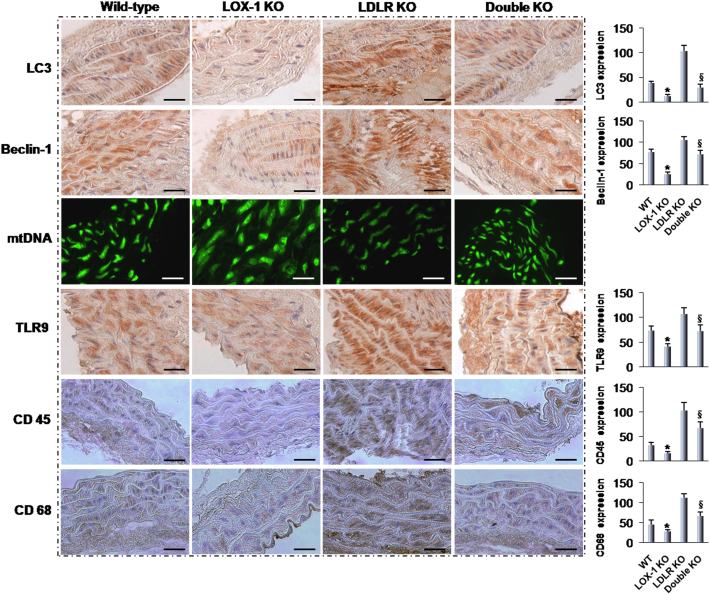
Figure 4. Immunohistochemistry markers of autophagy, mtDNA damage, and inflammation.
The expression of LC3 and beclin-1 (autophagy markers) is much higher in the LDLR KO and LDLR/LOX-1 DKO mice than in their counterpart WT and LOX-1 KO mice. Staining for mtDNA damage, TLR9 and inflammatory cell accumulation (CD45 and CD68) show similar pattern. The pictures are representative of multiple sections of aortas from different groups of mice (at least 5 in each group). Bar graphs represent data in mean ± SD based on 3–5 experiments. * P<0.05: LOX-1 KO vs. WT; §P<0.05: Double KO vs. LDLR KO. Scale bars: 80 μm.

