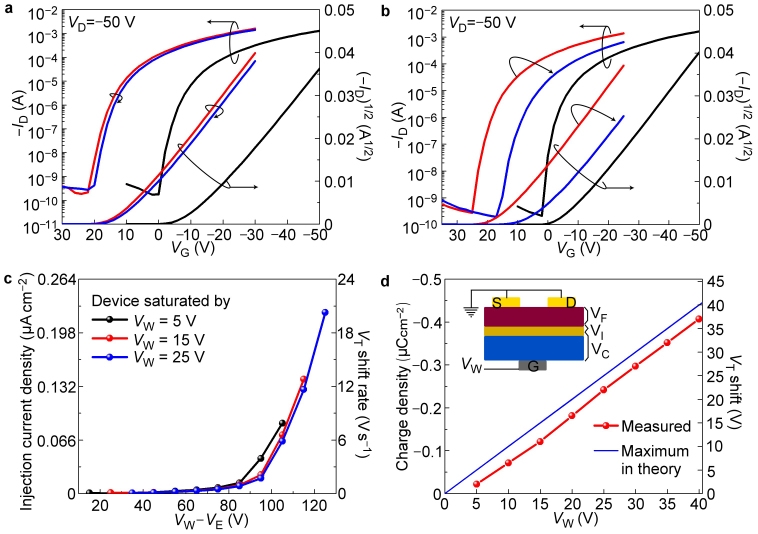
Figure 3. Electrical characters of LCOMs.
(a) The transfer curve evolution after storage for 20000 s as the gate voltage was kept at 0 V. As calculated, 92% of the charges in the memory layer retained after storage for 20000 s. The trapped charges escaped at an average rate of 9.3×10⁻¹³ A cm−2. (b) The transfer curve evolution after a 0.5 s erasing voltage (VE) pulse of −100 V. (c) Plot of average hole injection current (the number equals to the rate of electrons flowing out but opposite in direction) versus erasing voltage (VE) for devices saturated by different writing voltage (VW). (d) The calculated maximum electron density under different writing voltage (VW) and the measured results. Inset: voltage distribution across the device as the gate voltage was positively biased (VW).

