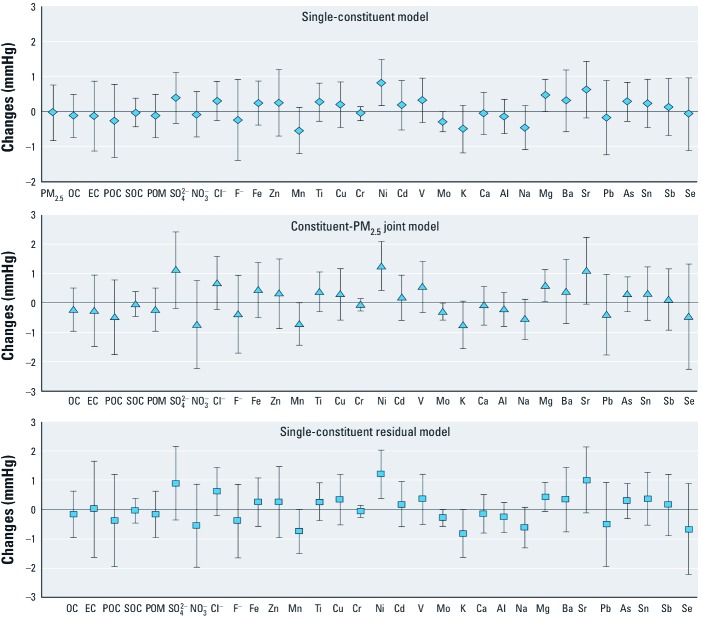
Figure 4.
Changes in PP associated with IQR increases in PM2.5 constituents at concentration during the preceding day before the BP measurement. Estimates are adjusted for age, BMI, season, month, day-of-study, squared day-of-study, day-of-week, hour-of-day, study site, temperature, and relative humidity in linear and quadratic terms. Data are presented as effect estimates ± 95% CIs. For constituent-PM2.5 joint models, we used the main effect estimates of PM2.5 constituents for result presentation.

